


Stock Market Update: Don't Fool with the Fed!
Stock-Markets / US Stock Markets Sep 23, 2007 - 01:56 AM GMTBy: Dominick
 Did someone order a breakout? Or a bear sandwich? The Feds went hunting for shorts again this week with a 50 basis point cut in their overnight target rate that sparked the biggest one day rally in years. And, just like after their surprise cut of the discount rate in August, short positions were forced to cover en masse as there was little if anything to suggest in advance such a dramatic policy shift was forthcoming.
Of course, last week's newsletter advised not gaming the Fed, or any news for that matter, but simply sticking to the game plan, which was, as always, trading around our proprietary numbers and the obvious support and resistance levels suggested by our charts and indicators. Keeping In mind the general principal that you can't lose a game that you don't play, we went to work early in the week looking for any low risk support that may give members a cheap entry point so that, if they chose to, they could go into the Fed with at least a few points of profit as a cushion. The first chart below shows a double bottom in globex trading prior to Monday's open, with a long trade from that level yielding 10 points shortly after the open in New York .
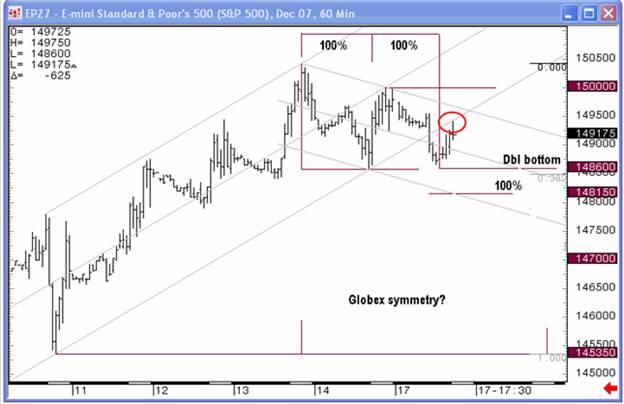
Members with a stronger appetite for risk might have elected to hold their long position from 1485 in the December contract and, if they did so, took home 48 points of profit into our target for Tuesday's close! The market actually traded sideways most of the day Monday, though, and this gave other members who may have missed the globex session a chance to also take this low risk long side entry point pre-Fed. However, to be honest, my recommendation in the chat room, and what I personally elected to do with my own trade, was to take the profit and get flat, take the money and run (TMAR), since I'd always rather have that cash in my pocket and wait to trade the obvious setups than leave money on the table in front of an unpredictable event like the Fed.
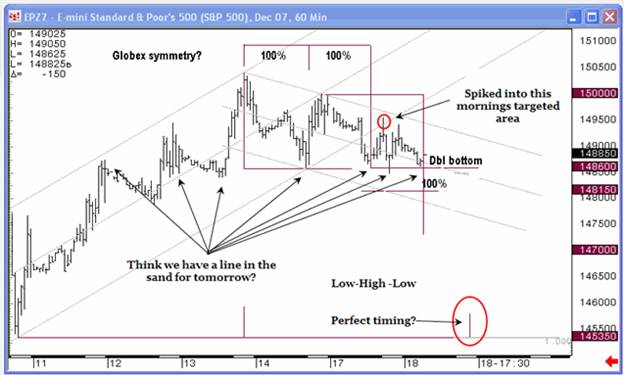
So, I'm never above creating extra value for members should they choose to take on more risk, but I also offer and prefer to stick to much easier trades. Below is the globex symmetry chart from Monday morning as updated and reposted on Tuesday. It shows the frequency with which the S&P December futures contract hit and turned at 1485 making this an obvious line in the sand for shorting reaction to the Fed statement, whatever it might bring, or for staying long. The low to high to low timing cycle suggested a high late Tuesday or early Wednesday which alone wouldn't be enough to trade, but taken in addition to other targets and charts, was consistent with our expectation – as long as the market stayed above 1485.
And well now, of course, the Fed's rate cut and the market's response are all in the history books, but what still needs to be entered into the record is how TTC played the rest of the week, how our numbers hit beautifully, and how our members made money while most others got run over by a charging bull.
Going into Fed day, members were again cautioned against assuming they knew the outcome of the afternoon statement or trading the initial reaction. We are, afterall, the internet's only true unbiased trading community and, if anything, the only predictable aspect of all Fed days is that the trading will be jerky, with lots of fakeouts. After having seriously compressed for several days in anticipation of a rate cut, it was clear the market was about to break out in a big way, possibly reaching 1525 or 1450 in a single day, and, whereas many view this situation as an opportunity to take on excessive risk in order to buy the bottom or sell the top, to the unbiased it is an obvious chance to observe the trend first and make an easy trade so as to realize more reward than risk. Keep reading if you want to see how it's done.
As you'll recally, most of us were flat going into the statement and for most of the initial pop that followed. Anyone that bet short against the Fed got creamed in those first few minutes, literally thrown under the bus, even if they had stops. You don't actually think when those stops turned into market orders that they got filled one or two ticks above, do you? No way. And who knows, the same could have happened to the bulls in another situation – all I'm sure of is that my members had 10 points from Monday and didn't lose a penny in the initial knee-jerk response to the rate cut. But that's not even the beautiful part yet.
The chart below shows all our trades, all we needed to know, from the Fed's decision through the end of the week. As you can see, our first move post-Fed was not to pile into to a crowded momentum trade. But our patience was rewarded less than fifteen minutes after the release of the Fed statement as the market retested 1511, a number we'd been watching earlier. In chat and on the forum, the understanding was that a successful retest of this level was the green light for a long and as the market closed back in on this level, ultimately getting as low as about 1512, TTC members pulled the trigger and got long what looked to many like a spent move. After having traded above 1525 and then retracing more than ten points down, the thought that the top for the day probably occurred to more than a few. But, of course, this was just an opportunity for shorts to get hammered again.
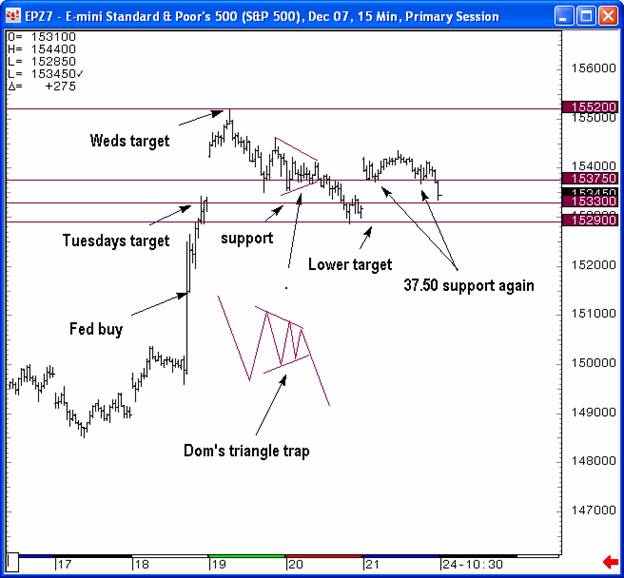
Watching the market quickly reverse from our buy level and take out its previous high of the day was a thrill for many – the first such thrill for several of our newest members. But as the market moved back into a narrow consolidation after putting a quick ten points or so in our pockets, the call to take profits was not yet sounded. As you see in the chart above, the target for the day was boosted to 1533 and believers who again exercised a little patience were rewarded as the market moved precisely to this level and vibrated around it into the close.
Despite hitting the day's target, the suggestion that there could be more on this rally should have kept at least the swing trade members from closing their long positions entirely, though taking some profit never hurt anybody. As the Wednesday morning globex session validated this expectation, finding even more premature shorts to punish, our ultimate target for the whole Fed rally reaction was posted in the TTC forums. The chart above shows 1552, our target, a number that may have seemed unlikely after the already huge run, was hit with precision before noon . For those who'd bought 1486 or 1511, it was the quintessential TMAR (“take the money and run”) opportunity, the coup de grace of a very profitable trade that, as you recall, had nothing to do with predicting the Federal Reserve's policies or reading into economic data or listening in on conference calls from the brokers. Selling 1552 will stand as a victory for unbiased trading and TTC.
What followed over the rest of the week was a bit less exciting, but then again it's hard to compete with a quick 40 points or so! More than a few members made enough to pay for years of their subscription on this week alone, but most have no problem earning it back month to month anyway. If some members took the rest of the week off and celebrated their winnings, I'm happy for them, but most of us continued to do what we always do – find more setups and make more money.
After getting the pull back from 1552 we entirely expected, late Wednesday and early Thursday trading centered around our 1537.50 pivot. The chart above shows the market putting in what's called “Dom's Triangle Trap” right on top of this critical level. The triangle trap is simply a move that appears to setup like a triangle, baiting bullish traders, only to break down rather than thrust up. After price collapsed from the bottom of the trap, the levels we had to watch were 1533 and 1529. As it turned out, the exact low of the day was 1528.50!
Going into the close it was obvious this probable fourth wave consolidation from the 1552 high came at a perfect time for market makers to retire all the puts they sold weeks ago ahead of a quadruple witching. Anything but a selloff that couldn't recover would suggest at least a small rally from the 1529 support, and the likelihood of a gap up was suggested Thursday afternoon. That the rally did materialize as a gap up at Friday morning's open put the final nail in the coffin for any cash index or futures index puts, which are exercised based on the opening price. Support at the 1537.50 pivot again asserted itself later in the day, suggesting another long at least into the next resistance level on the chart above, though, as usual, we were prepared to go into the weekend flat and await the direction of the next short term trend.
As beautiful as this week proved to be for unbiased traders at TTC, it's no time to rest as big moves are still out there, building just below the surface. Is there anyone who thinks the housing recession is over now because of the rate cut? Has the all-clear really been sounded? There are some now who think that with gold, oil and a number of other commodities at record or near-record highs, Bernanke's opened the door to another round of inflation that will prove this rate cut to be a horrible mistake. Or will hindsight show this cut was just the tip of the iceberg and not really as dramatic as it seemed at 2:15 on Tuesday?
Certainly there are both bullish and bearish chart patterns to be seen right now, but as we watch the squiggles and wiggles of the S&P for the next short term move, the most interesting charts to me are in the commodities, gold, oils and grains, and the euro, all of which are approaching targets I've been watching for months or even years in some cases. What if commodities are in a blowoff and soon to reach an intermediate top – would Bernanke's cut look so foolish then? Of course, as we go forward, we won't be fooling with the Fed. As always, our trading will be based on unbiased reading of our charts and technical indicators, along the lines of what's been explained here today, and, if you want a piece of the action, it's as easy as joining today!
Have a profitable and safe week trading, and remember:
“Unbiased Elliott Wave works!”
By Dominick
For real-time analysis, become a member for only $89
If you've enjoyed this article, signup for Market Updates , our monthly newsletter, and, for more immediate analysis and market reaction, view my work and the charts exchanged between our seasoned traders in TradingtheCharts forum . Continued success has inspired expansion of the “open access to non subscribers” forums, and our Market Advisory members and I have agreed to post our work in these forums periodically. Explore services from Wall Street's best, including Jim Curry, Tim Ords, Glen Neely, Richard Rhodes, Andre Gratian, Bob Carver, Eric Hadik, Chartsedge, Elliott today, Stock Barometer, Harry Boxer, Mike Paulenoff and others. Try them all, subscribe to the ones that suit your style, and accelerate your trading profits! These forums are on the top of the homepage at Trading the Charts. Market analysts are always welcome to contribute to the Forum or newsletter. Email me @ Dominick@tradingthecharts.com if you have any interest.
This update is provided as general information and is not an investment recommendation. TTC accepts no liability whatsoever for any losses resulting from action taken based on the contents of its charts, commentaries, or price data. Securities and commodities markets involve inherent risk and not all positions are suitable for each individual. Check with your licensed financial advisor or broker prior to taking any action.
Dominick Archive |
© 2005-2022 http://www.MarketOracle.co.uk - The Market Oracle is a FREE Daily Financial Markets Analysis & Forecasting online publication.