


Will the Gold Rally Last?
Commodities / Gold and Silver 2011 Jan 09, 2011 - 10:31 AM GMTBy: Merv_Burak

 It seems that gold puts on a rally of sorts at the end of the year. The big question always is “will it last?” It seems that this year it may not last but the action is still not all that bearish so there is hope that the down side will be short.
GOLD : LONG TERM
We can dispense with the long term P&F chart real quick. Nothing has changed in the past few weeks as far as the chart message is concerned. Although the present direction of the chart is downward the trend is still bullish and would need a move to the $1320 level to give us a long term reversal signal (although $1305 would be a stronger signal).
As for the normal long term indicators, gold remains comfortably above its positive sloping long term moving average line. The long term momentum indicator remains in its positive zone but is moving lower and has now moved below its negative sloping trigger line. As for the volume indicator, it has just dropped below its long term trigger line but the trigger remains in an upward slope. For those who love trend lines the volume indicator has also just dropped below a one year old up trend line. From a long term perspective gold price has been moving inside an up trending channel that is over two years old. The latest gold price is about at the mid point of the channel so it has some distance before it breaches either the upper resistance or the lower support trend lines. On the support side the up trend line is at about the $1275 level which is considerably below the P&F reversal level noted above. Anyway, putting these indicators all together the long term rating remains BULLISH.
INTERMEDIATE TERM
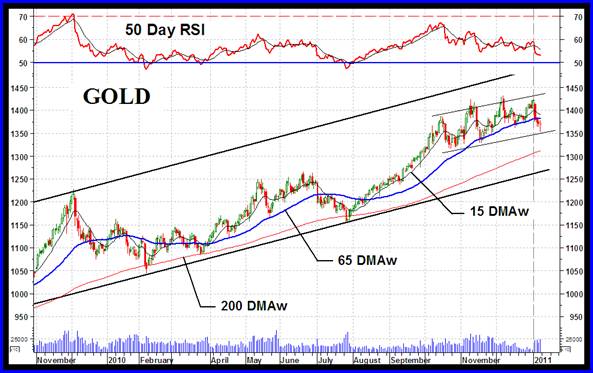
The gold chart today shows the past year and a bit of daily historical trading activity. The three basic time period moving averages are there along with my intermediate term momentum indicator. What we see here is the extension of the long term channel mentioned in the previous section along with an intermediate term channel that has trapped the past few months of action. The gold price on Friday seems to have just about touched the lower support trend line of the smaller channel and then bounced. We now need to see to what extent this bounce will continue to the up side or will revert back to the down side and breach this smaller channel. With the New Year the daily volume has once more started to improve, however, it’s just too bad that the price trend has been to the down side during this volume improvement.
Looking at the normal indicators gold has now moved below its intermediate term moving average line and the line slope has just turned very, very slightly negative. The intermediate term momentum indicator remains in its positive zone but has moved below its trigger line and the trigger has turned to the down side. As for the volume indicator, it has crossed below its intermediate term trigger line and the trigger has turned downward. Putting it all together the intermediate term rating has now dropped to the BEARISH side. The short term moving average line remains above the intermediate term line for a non-confirmation of the bear.
SHORT TERM
I usually show a short term chart of the gold action but this week the intermediate term one (above) will do. Since early October the momentum indicator (both short and intermediate term) has been showing a consistent lower peaks while the price of gold has been making higher peaks. Gold finally made a lower peak during the first trading day of the New Year and the trend has been lower since. With consistently lower lows the momentum indicator has been showing weakness in the gold price activity for a few months now. There is also a case to be made that we have a potential head and shoulder top pattern with a convoluted double shoulder on the left side but I don’t like to get too convoluted in my analysis and prefer to keep it simple so I’ll just go with the slight up trending channel as the pattern here.
Gold closed below its short term moving average line during the Tuesday plunge, pulling the line down with it. It has been trading below the moving average since and the moving average has continued in its negative direction. The short term momentum indicator is in its negative zone and below its negative sloping trigger line. The daily volume activity has been quite improved over the holiday volume but this is during negative price days and not helping. For now the short term rating remains BEARISH. The very short term moving average line (not shown this week) has now crossed below the short term line confirming this bear.
As for the immediate direction of least resistance, that’s a tricky one. Everything looks negative but Friday’s action seems like it could be the start of a positive bounce. The Stochastic Oscillator is still in its oversold zone but has turned around and could break above its oversold line on another day’s action. I’m inclined to see a positive move at the beginning of the week but will go with a lateral move for Monday.
SILVER
Them that moves up the highest can drop the furthest, so it is with silver, versus gold. Silver dropped a whopping 7.3% this past week while gold dropped just half of that. Still, over the three basic investment time periods silver remains the top performer.
Depending upon the time period P&F chart one uses we do have a solid support at the $28.50 level, where the price is at the present. The intermediate term moving average line is at about the same level so we should see silver remain above the P&F support and above the moving average line. Should the price drop to the $28.00 level breaking below the P&F support, that would give us an initial projection to the $23.00 level for a decent decline but not a disaster. This break would also break a secondary up trend line BUT NOT the primary line so some positive can still be gleamed should a break occur. The primary line is at the $26.50 level. My normal P&F criteria for a reversal requires both a support break and a primary up trend line break. I do use a secondary line break when the primary line is so far away from the support break.
Without going into the details this week the ratings for silver are BULLISH for the long and intermediate term and BEARISH for the short term. The very short term moving average line has just crossed below the short term line for the first time in several weeks confirming the short term bear. As with gold the aggressive Stochastic Oscillator is in its oversold zone but has started a turn back to the up side and may suggest a rally within the next day or two.
PRECIOUS METAL STOCKS
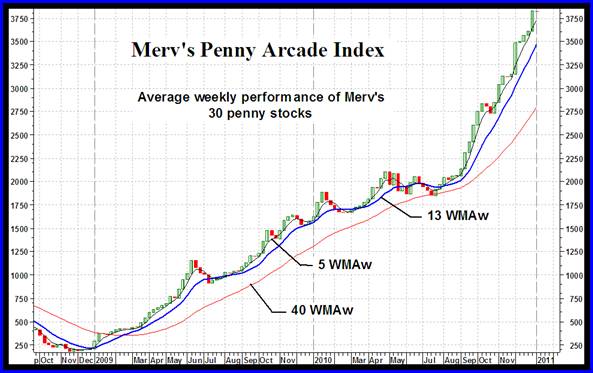
We are starting to hear some rumblings that gold (and silver) have over reached their moves and a serious reversal may be just ahead. Well, the performance of the gambling variety of stocks, the pennies, does not yet indicate any serious reversal eminent. Reactions do happen and we may be seeing a reaction now but the Merv’s Penny Arcade Index remains very strong suggesting the speculators continue to put their money into the more speculative stocks. This is not the actions of the speculators when serious declines loom ahead. While most Indices declined by more than 7% this past week (see the Table at the end of the commentary) the Penny Arcade Index barely moved. It declined by only 0.2% and not even noticeable on the weekly Index chart. Since bottoming out in Nov of 2008 the Merv’s Penny Arcade Index has gained 2008% in value, this is a 20 bagger move. Not bad for an average performance of 30 stocks. Of course these stocks have not all been in the Index during this whole period. The Index gets updated as required based upon the continuing performance of the component stocks. Still, 2008% gain in two years is not so shabby. There WILL come a time when things fall apart and the pennies will take a real drubbing but as shown in the past, these stocks decline about on an EQUAL basis as the decline of the top quality stocks. The thing is not to keep holding for dear life during the decline. Technical concepts should keep you safe. So, what to look for?
Based upon weekly data as long as the Index remains above its short term weekly moving average line everything is roses. As long as the short term moving average line remains above the intermediate term moving average line we are in a bullish intermediate term trend. As long as the short term moving average line remains above the long term moving average line we remain in a long term bull. At all other times, well one should check the ratings in the Table posted each week with these commentaries.
Merv’s Precious Metals Indices Table
Well, that’s it for this week. Comments are always welcome and should be addressed to mervburak@gmail.com.
By Merv Burak, CMT
Hudson Aero/Systems Inc.
Technical Information Group
for Merv's Precious Metals Central
For DAILY Uranium stock commentary and WEEKLY Uranium market update check out my new Technically Uranium with Merv blog at http://techuranium.blogspot.com .
During the day Merv practices his engineering profession as a Consulting Aerospace Engineer. Once the sun goes down and night descends upon the earth Merv dons his other hat as a Chartered Market Technician ( CMT ) and tries to decipher what's going on in the securities markets. As an underground surveyor in the gold mines of Canada 's Northwest Territories in his youth, Merv has a soft spot for the gold industry and has developed several Gold Indices reflecting different aspects of the industry. As a basically lazy individual Merv's driving focus is to KEEP IT SIMPLE .
To find out more about Merv's various Gold Indices and component stocks, please visit http://preciousmetalscentral.com . There you will find samples of the Indices and their component stocks plus other publications of interest to gold investors.
Before you invest, Always check your market timing with a Qualified Professional Market Technician
Merv Burak Archive |
© 2005-2022 http://www.MarketOracle.co.uk - The Market Oracle is a FREE Daily Financial Markets Analysis & Forecasting online publication.