U.S. Transportation charts heralding a change of Stock Market direction?
Stock-Markets / Stock Markets 2011 Jan 23, 2011 - 08:16 AM GMTBy: Garry_Abeshouse

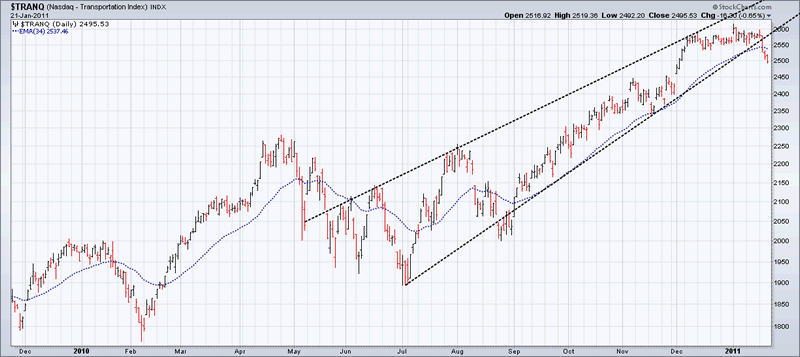
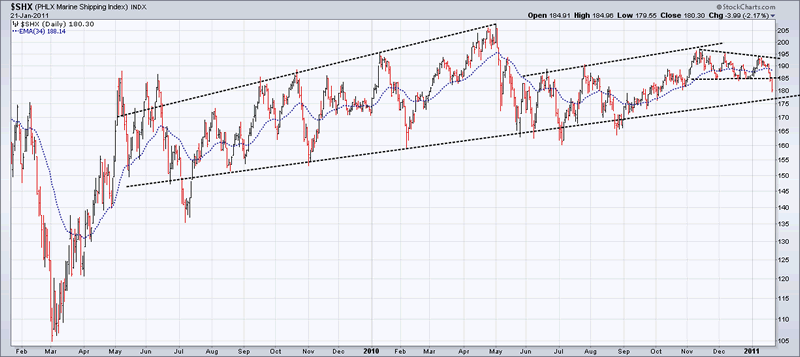
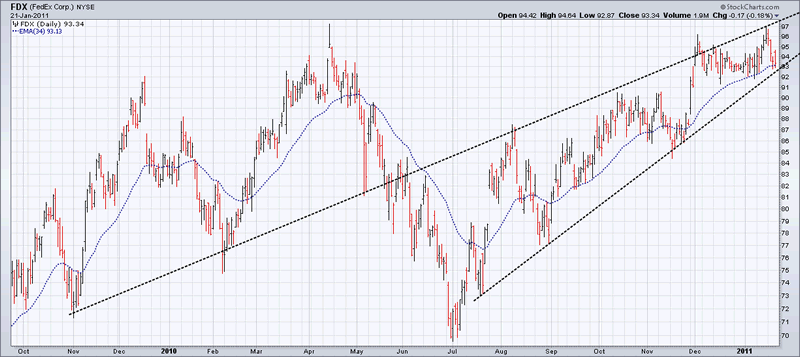
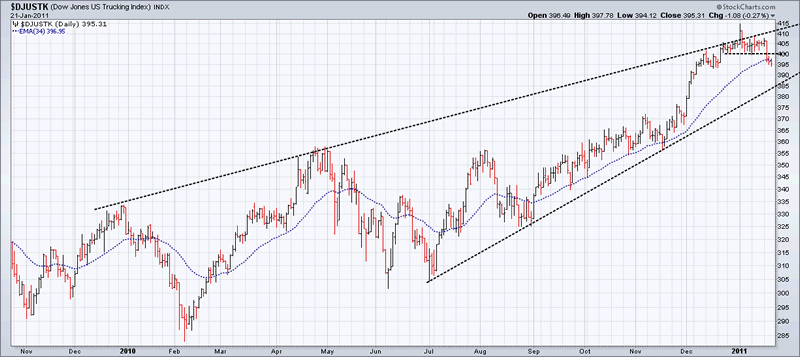
 Transportation is one of the main barometers of economic health and as such, this sector should be the first or one of the first to confirm a topping out process.
It is the first sector to show charts breaking support levels and uptrends, but it is early days yet and more confirmations are needed.
Since the second half of 2009, the proliferation of upward wedge patterns have been a constant reminder that we remain within a bear market rally, albeit an extraordinary long one historically. To me, this suggests that if their bearish promise holds true to form, then a resumption of the bear trend becomes a high probability future event.
And once a broad cross-section of wedge uptrends are decisively broken, these patterns have a reliable history of showing precipitous prices falls.
On the other hand, as 70% of market turnover is now high frequency trading (unlike the good old days prior to the year 2000), then the banks and hedge funds will certainly try and put off the inevitable by attempting to hold the markets up at these high levels for as long as possible.
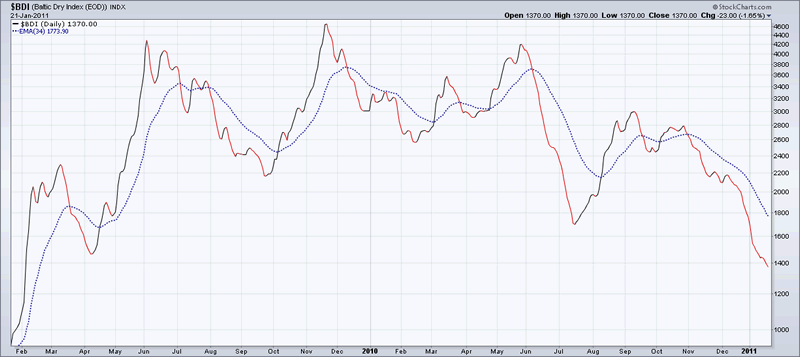
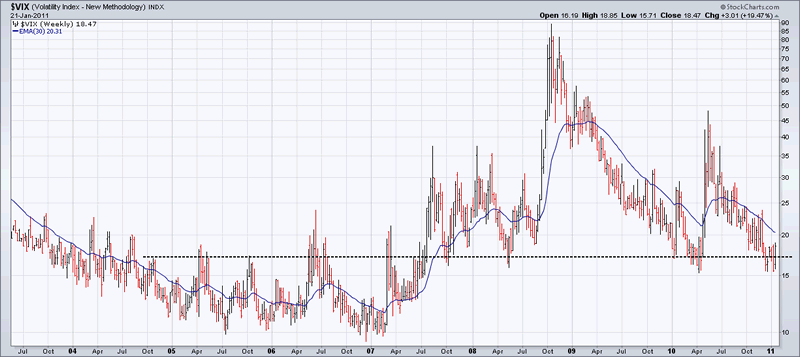
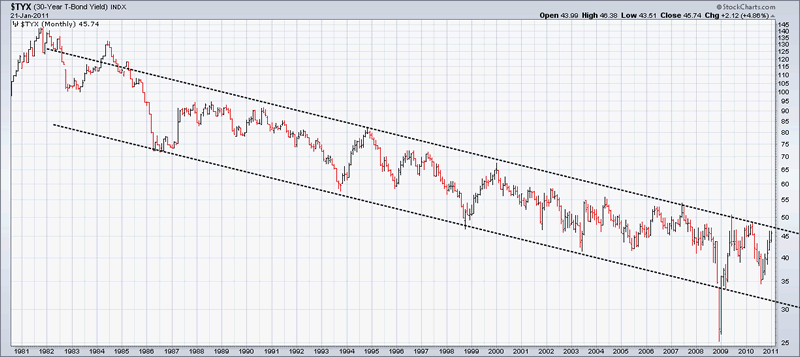
But from now on though, my market timer is counting backwards to the abyss rather than forward into any longer term bull trend. The current low level of the VIX indicator suggests the engagement of a topping out process, with the leading economic indicator, the Baltic Dry Index, falling steadily during the recent price rise in equities. The monthly 30yr T-Bond Yield chart also seems to confirm a bearish view by testing the resistance line of a well entrenched 30 year downtrend. This testing is complemented by a strong inverse showing with the VIX over the last few years.
Unfortunately, a by-product of this topping out process is that it automatically increases stress on the weakest links within the financial markets. The Lehman Bros debacle of September 15th 2008 was one such break of a weak link not so long ago.
Considering world debt levels have changed little since then, a new financial crisis from within the confines of the Quadrillion US Dollars of outstanding world debt, much of it off balance sheet and partly invisible, would appear to be on the cards in the not too distant future.
Till next time.
Garry Abeshouse
Technical Analyst.
Sydney
Australia
I have been practicing Technical Analysis since 1969, learning the hard way during the Australian Mining Boom. I was Head Chartist with Bain & Co, (now Deutsch Bank)in the mid 1970's and am now working freelance. I am currently writing a series of articles for the international "Your Trading Edge" magazine entitled "Market Cycles and Technical Analysis".
I have always specialised in medium to long term market strategies and after discovering the excellent Point & Figure Charts from Stockcharts.com in mid 2008, have concentrated on this style of charting ever since.
© Copyright Garry Abeshouse 2011
Disclaimer: The above is a matter of opinion provided for general information purposes only and is not intended as investment advice. Information and analysis above are derived from sources and utilising methods believed to be reliable, but we cannot accept responsibility for any losses you may incur as a result of this analysis. Individuals should consult with their personal financial advisors.
© 2005-2022 http://www.MarketOracle.co.uk - The Market Oracle is a FREE Daily Financial Markets Analysis & Forecasting online publication.


