Stock Market Investor Sentiment and a Quick Dow Theory Update
Stock-Markets / Stock Market Sentiment Feb 26, 2011 - 03:27 PM GMTBy: Tim_Wood
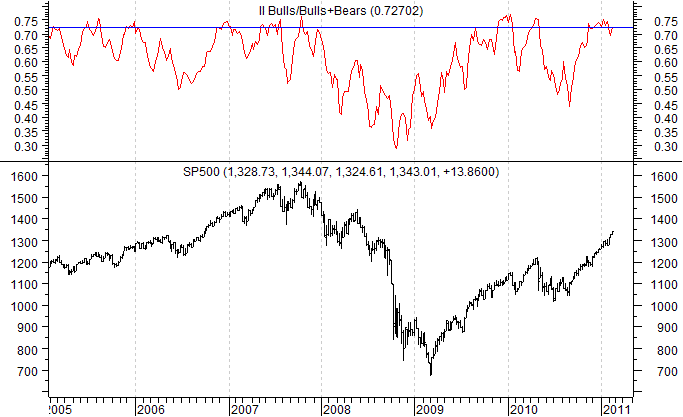
Sentiment alone is not a timing tool for the market. But, it is useful in telling us when too many people get on the same side of the boat, which in turn tells us that conditions have ripened for a turn. I have said many times of late that the recent sentiment environment reminded me of the 2006 and 2007 period. In the chart below I have included the S&P 500 and a sentiment indicator that is comprised of the Investor Intelligence Bulls divided by Bulls plus Bears. In other words, this shows us the percentage of Bulls to total Bulls and Bears. Now, note on the chart below that during the 2007 period when this reading rose above 72%, an intermediate-term top soon followed.
Now note that since the March 2009 low, every time the percent of Bulls rose above the 72% level an intermediate-term top has been at hand. Again, sentiment readings are not timing tools, but this is telling us that conditions have been ripe for another intermediate-term top and based on the price action this past week, that top may very well be in place. I will have to look at other indicators after the weekly close in order to determine if an intermediate-term sell signal has indeed been triggered and I will report this in my subscriber updates. If it proves the market has in fact made an intermediate-term top, then the correction that follows should carry this sentiment indicator down toward the 50% mark. More importantly, once price moves into our timing band for the next intermediate-term cycle low, along with these lower sentiment readings we will be able to zero in on the next intermediate-term low and buying opportunity.

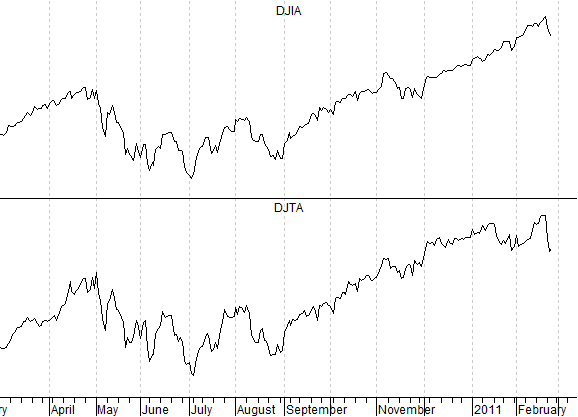
In the next chart below I have included both the Dow Jones Industrials and the Transports. In light of the recent weakness, the Transports have shown more relative weakness than the Industrials. I have again received questions as to whether this relative weakness has any forecasting value from a Dow Theory perspective. The answer is no. When considering Dow theory it is the movement of both averages above or below previous secondary high points that is important. To consider only one average or to try to infer a meaning from the movement of only one average is not Dow theory.
If this correction should carry both averages below the January 28th lows, on a closing basis, then the next error I see coming from a Dow theory perspective will be that people will be mistakenly calling such price action a Dow theory “Sell Signal.” Granted, any violation of the January lows should be followed by further weakness. But, any such weakness will be associated with a decline into the next Secondary Low Point and not a Dow theory “sell signal.” So, I want to warn you ahead of time, do not listen to any such comments that you may see or hear in regard to any such weakness because it will not be correct in accordance with orthodox Dow theory.

I have begun doing free market commentary that is available at www.cyclesman.info/Articles.htm The specifics on Dow theory, my statistics, model expectations, and timing are available through a subscription to Cycles News & Views and the short-term updates. I have gone back to the inception of the Dow Jones Industrial Average in 1896 and identified the common traits associated with all major market tops. Thus, I know with a high degree of probability what this bear market rally top will look like and how to identify it. These details are covered in the monthly research letters as it unfolds. I also provide important turn point analysis using the unique Cycle Turn Indicator on the stock market, the dollar, bonds, gold, silver, oil, gasoline, the XAU and more. A subscription includes access to the monthly issues of Cycles News & Views covering the Dow theory, and very detailed statistical-based analysis plus updates 3 times a week.
By Tim Wood
Cyclesman.com
© 2011 Cycles News & Views; All Rights Reserved
Tim Wood specialises in Dow Theory and Cycles Analysis - Should you be interested in analysis that provides intermediate-term turn points utilizing the Cycle Turn Indicator as well as coverage on the Dow theory, other price quantification methods and all the statistical data surrounding the 4-year cycle, then please visit www.cyclesman.com for more details. A subscription includes access to the monthly issues of Cycles News & Views covering the stock market, the dollar, bonds and gold. I also cover other areas of interest at important turn points such as gasoline, oil, silver, the XAU and recently I have even covered corn. I also provide updates 3 times a week plus additional weekend updates on the Cycle Turn Indicator on most all areas of concern. I also give specific expectations for turn points of the short, intermediate and longer-term cycles based on historical quantification.
Tim Wood Archive |
© 2005-2022 http://www.MarketOracle.co.uk - The Market Oracle is a FREE Daily Financial Markets Analysis & Forecasting online publication.


