


U.S. Treasury Bond 10 Year Index Elliott Wave Analysis
Interest-Rates / US Bonds Mar 09, 2011 - 08:47 AM GMTBy: David_Petch

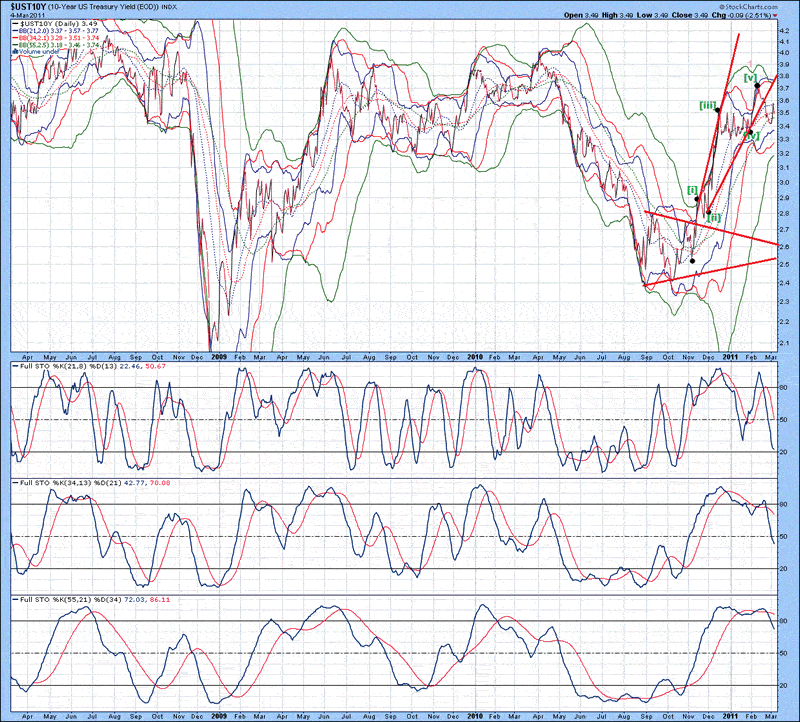
 The daily chart of the 10 Year US Treasury Index is shown below, with upper and lower Bollinger bands in close proximity to the current price. Full stochastics 1, 2 and 3 are shown below in order of descent, with the %K beneath the %D in all three instances. I illustrated the short-term Elliott Wave count, which clearly indicates a change of trend. This is a real trend definer, because gold does well with rising interest rates (not year over year inflation).
Wave 1 lasted ~3 months and went up 1.2%. Wave 2 should last until early May correcting down to the 3.2-3.3 region. Wave 3 should be at least 1.618 fold higher in price, so 1.618 x 1.2 is equal to 1.94 (essentially 2). Tack this onto 3.2 and the TNX rates are at 5.2%. Wave 3 is likely to take 5-6 months to complete this...or late 2011/early 2012. Wave 4 should take an equivalent amount of time or till May to June. If wave 4 corrects back to 4.5%, then a 1.2% move up to have equivalency to wave 1 is 5.7% in late 2012. Wave 2 should retrace 50-61.8% of wave 1, which would see a decline back to around 3.9%. This decline will correspond to wave 2 lasting all of 2013 and into 2014 which will see declining assets prices across the board. Subsequently, waves 3, 4 and 5 to follow would put interest rates around 8-10%...at a minimum.
Figure 1
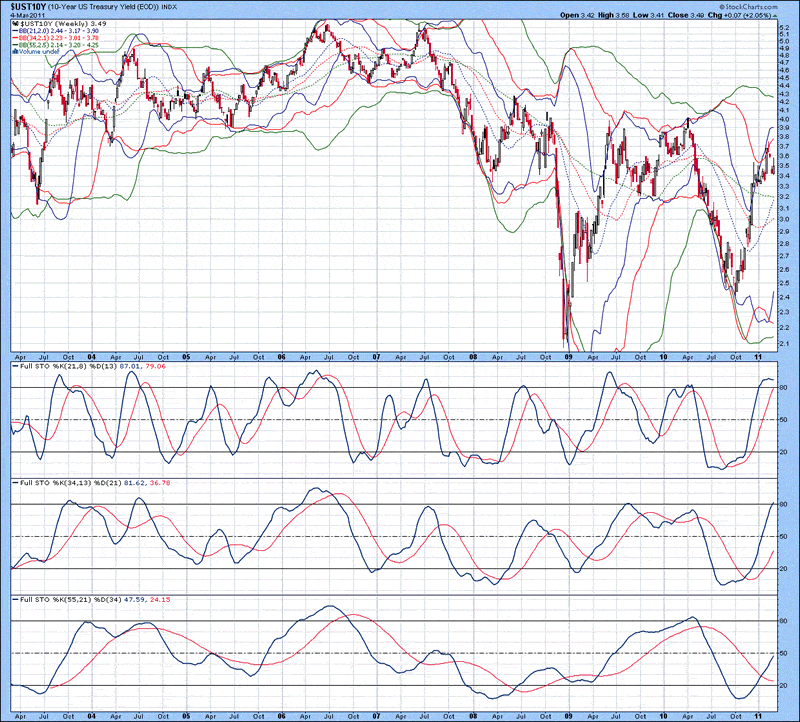
The weekly chart of the 10 Year US Treasury Index is shown below, with upper 21 and 34 MA Bollinger bands above the index, suggestive that a mid-term top was put in place. Lower 34 and 55 MA Bollinger bands aer well beneath the index, suggestive that the mid-term trend is still intact. Full stochastics 1, 2 and 3 are shown below in order of descent, with the %K above the %D in all three instances. Although a 3 month correction in wave 2 should be expected, by no means anticipate the that rising interest rates are not locked in. The mid-term trend should be up for the next 12-18 months overall.
Figure 2
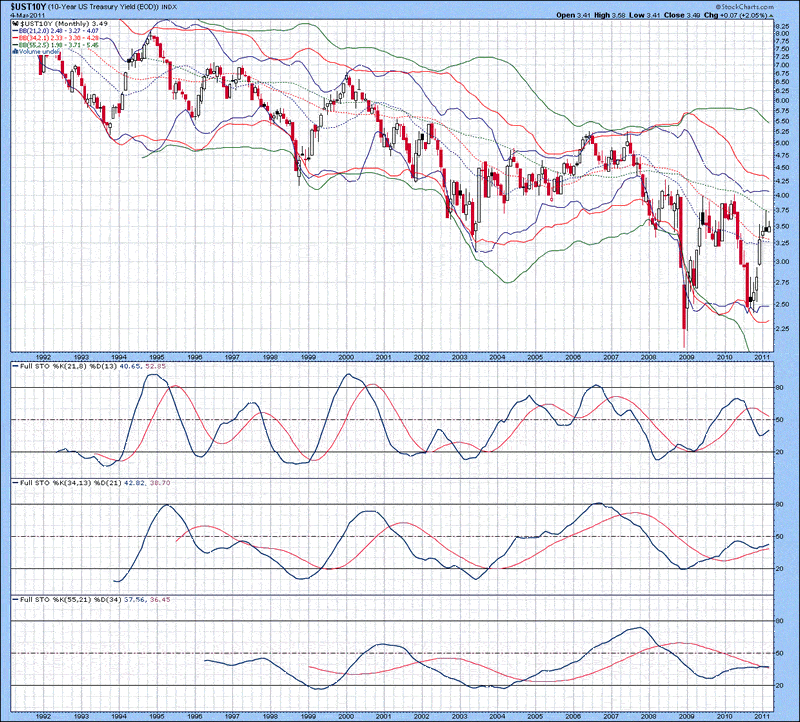
The monthly chart of the TNX| is shown below, with lower Bollinger bands still well beneath the index. Full stochastics 1, 2 and 3 are shown below in order of descent, with the %K beneath the %D in 1 and above the %D in 2 and 3. The upward trend of the TNX should be on the order of 5-7 years.
Figure 3
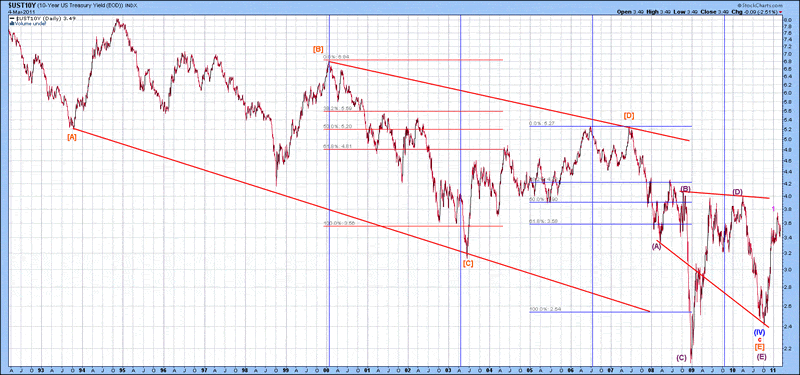
The Elliott Wave count of the 10 Year US Treasury Index is shown below, with wave 1 shown to have recently completed. Note that I may raise the Degree of wave 1 to (1) at a later point in time if required...the present Degree of labelling at present is sufficient to illustrate the trend. The recent low back in November saw the conclusion of a contracting triangle with reverse alternation to end the 30 year decline in interest rates. Now, things to preserve wealth will be in tangible items.
Figure 4
Since I am not talking about precious metals until later this week, I thought I would provide an update on some things...
By David Petch
http://www.treasurechests.info
I generally try to write at least one editorial per week, although typically not as long as this one. At www.treasurechests.info , once per week (with updates if required), I track the Amex Gold BUGS Index, AMEX Oil Index, US Dollar Index, 10 Year US Treasury Index and the S&P 500 Index using various forms of technical analysis, including Elliott Wave. Captain Hook the site proprietor writes 2-3 articles per week on the “big picture” by tying in recent market action with numerous index ratios, money supply, COT positions etc. We also cover some 60 plus stocks in the precious metals, energy and base metals categories (with a focus on stocks around our provinces).
With the above being just one example of how we go about identifying value for investors, if this is the kind of analysis you are looking for we invite you to visit our site and discover more about how our service can further aid in achieving your financial goals. In this regard, whether it's top down macro-analysis designed to assist in opinion shaping and investment policy, or analysis on specific opportunities in the precious metals and energy sectors believed to possess exceptional value, like mindedly at Treasure Chests we in turn strive to provide the best value possible. So again, pay us a visit and discover why a small investment on your part could pay you handsome rewards in the not too distant future.
And of course if you have any questions, comments, or criticisms regarding the above, please feel free to drop us a line . We very much enjoy hearing from you on these items.
Disclaimer: The above is a matter of opinion and is not intended as investment advice. Information and analysis above are derived from sources and utilizing methods believed reliable, but we cannot accept responsibility for any trading losses you may incur as a result of this analysis. Comments within the text should not be construed as specific recommendations to buy or sell securities. Individuals should consult with their broker and personal financial advisors before engaging in any trading activities as we are not registered brokers or advisors. Certain statements included herein may constitute "forward-looking statements" with the meaning of certain securities legislative measures. Such forward-looking statements involve known and unknown risks, uncertainties and other factors that may cause the actual results, performance or achievements of the above mentioned companies, and / or industry results, to be materially different from any future results, performance or achievements expressed or implied by such forward-looking statements. Do your own due diligence.
Copyright © 2011 treasurechests.info Inc. All rights reserved.
Unless otherwise indicated, all materials on these pages are copyrighted by treasurechests.info Inc. No part of these pages, either text or image may be used for any purpose other than personal use. Therefore, reproduction, modification, storage in a retrieval system or retransmission, in any form or by any means, electronic, mechanical or otherwise, for reasons other than personal use, is strictly prohibited without prior written permission.
David Petch Archive |
© 2005-2022 http://www.MarketOracle.co.uk - The Market Oracle is a FREE Daily Financial Markets Analysis & Forecasting online publication.