US Treasury Yield BubbleomiX Forecast: 10 Year Bonds Still Targeting 3%
Interest-Rates / US Bonds Mar 18, 2011 - 07:55 AM GMTBy: Andrew_Butter
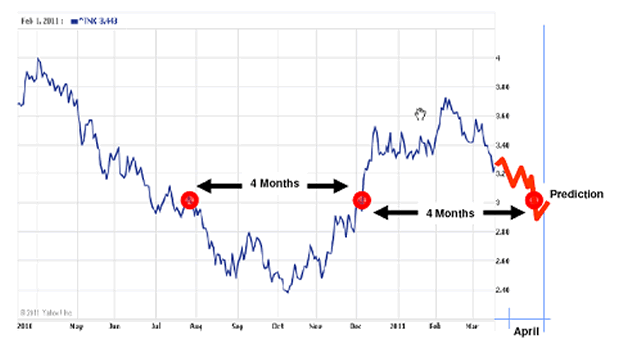
 Three months ago I wrote a piece saying that the 10-Year was heading for 3% by 20th February. http://www.marketoracle.co.uk/Article25128.html
I got a note from someone who is right more often than me saying he had it pegged at 3.8% . I’ll call that a draw although I noticed I made a mistake on the timing, what I really meant was April 20th; I’ll put that down to dyslexia.

The logic there was starting in August the market started to front-run the Fed creating a mini-bubble (the price of a bond is the reciprocal of the yield), then there was a mini-bust. If the Immutable Laws of BubbleomiX apply, then the “fundamental” in such circumstances is the square-root of the peak multiplied by the trough, which gets you to about 3%, Q.E.D.
I must say I was pretty surprised to hear that PIMCO had dumped all their Treasuries in January and February, by my reckoning they timed the bottom of the market almost to perfection, George Brown would have been proud.
There are a number of wonderful economic theories for what drives the price of US Treasuries which I suspect have their roots in the wonderful valuations that were assigned to all those Toxic Assets that in the event, sadly didn’t quite obey what passes for the Immutable Laws of Economics.
Apparently, according to those laws what drives the price (yield) is “expectations” of inflation and/or nominal GDP growth. As with most wonderful laws of economics, that’s wonderful, except for one small detail, they don’t work.
Leaving aside the fact that the economists can’t agree how to measure inflation, try plotting twenty or thirty years “forward” CPI or Nominal GDP (i.e. what actually happened) against US Treasury yields (on the assumption that “expectations” can predict the future – which is a pretty silly assumption if you are talking economics), and you get a pretty lousy correlation. But of course economists don’t care about lousy correlations, when reality contradicts their pre-conceived ideas.
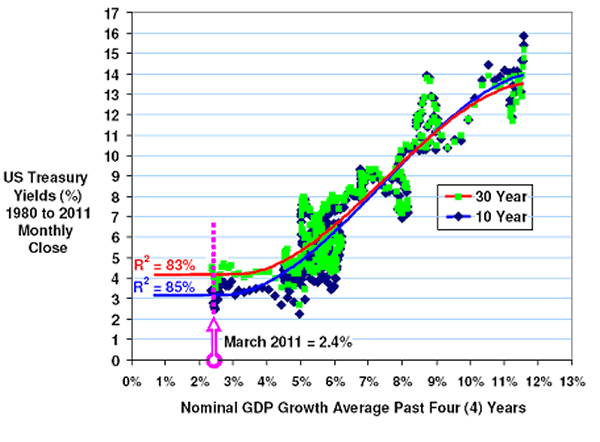
You get a better correlation if you plot the trailing average, this is a four-year-trailing average of Nominal GDP growth, plotted against yield going back to 1980:

That analysis says that Nominal GDP in the past explains 83% to 85% of changes in US Treasury yields. You could probably push that up to about 95% if you could be bothered to do multivariate analysis, but rough numbers I reckon 83% is “good enough for government work”.
What that also says is that the economic sins of the past, stay with you until what the Austrians call the “mal-investments” get washed out of the system, regardless of how hard the politicians try and “start with a clean sheet” to paper-over the extend and pretend.
So that analysis says the “fundamental” (that’s what International Valuation Standards calls “Other-Than-Market-Value”), is a tad over 3% for the 10-Year right now (and that’s what it’s going to be for the next year at least even if nominal GDP grows 5% a year from here on in).
That’s pretty consistent with the “Square-Root-of “Top”-multiplied-by-“Bottom” line of reasoning, which for me gives an added degree of confidence since those two ways of getting to the same answer are completely independent.
Notice also the “best-fit” is an “S” curve, which makes sense since even if nominal GDP is negative, people are going to always ask for some sort of return. Equally when inflation is raging (the main reason nominal GDP growth gets up to 16% or so), there is a limit on how much people will pay out in interest on a “safe bet”.
So “matey” – is the bet’s still on? How about going to ”Double or Quits?”
By Andrew Butter
Twenty years doing market analysis and valuations for investors in the Middle East, USA, and Europe; currently writing a book about BubbleOmics. Andrew Butter is managing partner of ABMC, an investment advisory firm, based in Dubai ( hbutter@eim.ae ), that he setup in 1999, and is has been involved advising on large scale real estate investments, mainly in Dubai.
© 2011 Copyright Andrew Butter- All Rights Reserved
Disclaimer: The above is a matter of opinion provided for general information purposes only and is not intended as investment advice. Information and analysis above are derived from sources and utilising methods believed to be reliable, but we cannot accept responsibility for any losses you may incur as a result of this analysis. Individuals should consult with their personal financial advisors.
Andrew Butter Archive |
© 2005-2022 http://www.MarketOracle.co.uk - The Market Oracle is a FREE Daily Financial Markets Analysis & Forecasting online publication.
Comments
|
Rich
02 Jun 11, 13:13 |
a month late
Andrew, Your call was about a month off (again) ... but it was the right call. Congrats! |


