


Stock Market Dow Theory Update
Stock-Markets / Dow Theory Jun 19, 2011 - 07:34 AM GMTBy: Tim_Wood

 According to Dow theory, once the primary trend is established, that trend must be considered intact until it is "authoritatively" reversed, which requires a joint move by the Industrials and the Transports back above/below their previous secondary high/low points. On March 9, 2009 the bear market phase I low was made. From that low point, the rally separating phase I from phase II began and on July 23, 2009 the bullish primary trend, in accordance to classical Dow theory and in association with the rally separating phase I from phase II, was confirmed. But, based on the longer-term work, this is expected to change and when it does, provided that the normal bull and bear market relationships still mean anything, the phase II decline will begin.
We are now seeing some intra-sector weakness within the Transportation sector. We are also seeing weakness in other areas, such as the automotive sector, banking, housing, commodities and even some of the overseas equity averages to name a few. But, is this a normal correction, or the beginning of the end for the advance that began at the 2009 lows? I have gone back to the inception of the Dow Jones Industrial Average in 1896 and identified a statistical based DNA Marker that has appeared at every major top since 1896. If things evolve in a way in which this DNA Marker appears, then it is highly likely that the decline into the phase II low has begun. If not, then this should prove to be a normal corrective period that will be followed by still higher prices until this Marker does appear. I look for this setup to occur later this year and I will be covering those developments in the monthly research letters at Cycles News and Views. For now, I want to take a look at some sub-sector weakness being seen by the Transports.
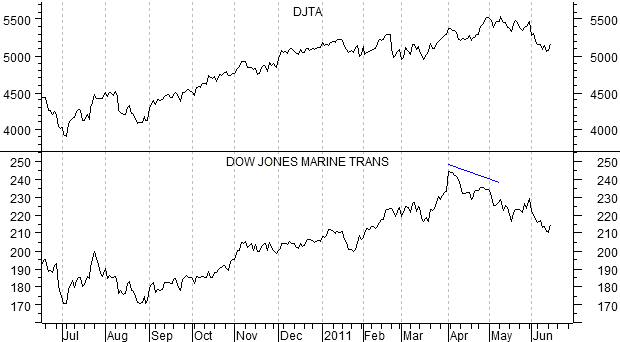
In the chart below I have included the Dow Jones Transportation Average along with the Dow Jones Marine Transportation Average. As you can see, the Marine average has begun to show more relative weakness than the overall Transportation average and it has moved below its previous secondary low point.
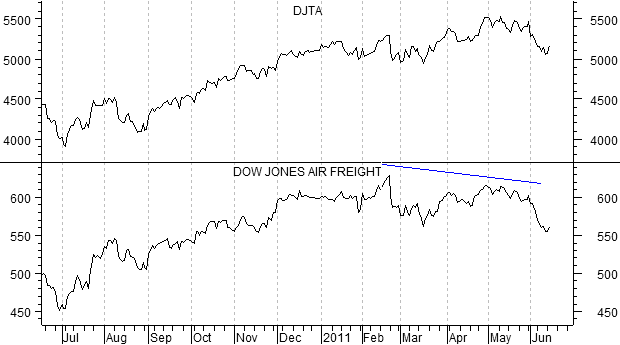
Next, I have the Dow Jones Transportation Average along with the Dow Jones Air Freight Average. Here too, the Air Freight Average is showing more relative weakness than the overall Transportation Average and has formed an upside non-confirmation with the Transports as well. Thus, this is currently a weak sector within the Transports and if we were to see this weakness spread to other sectors it would serve as a warning of further weakening for the Transports and perhaps of trouble from a Dow theory perspective.
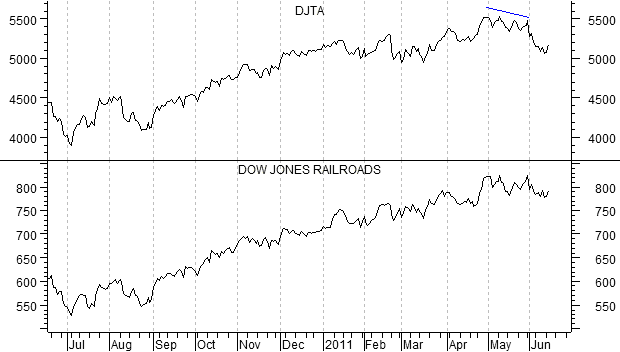
The overall Dow Jones Transportation Average and the Dow Jones Rail Road Average is next. In this case, the rails are actually stronger than the overall Transportation Average. Note that the Transports formed a non-confirmation with the rails at the May highs. So, in looking at this sub-sector, it is a strong hold at this time.
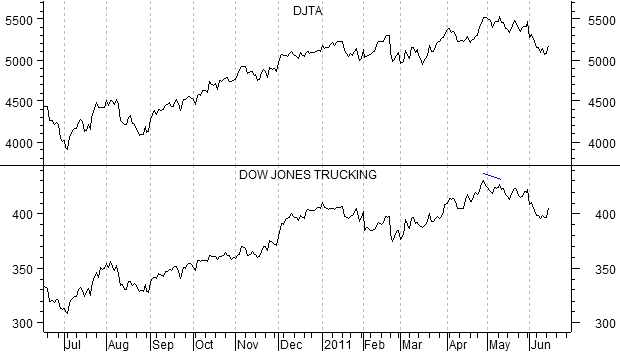
Lastly, I have included a chart of the Dow Jones Transportation Average along with the Dow Jones Trucking Average. This sub-sector formed a minor non-confirmation at the May high, but is for the most part in step with the overall Transportation Average.
We have looked at these sub-sectors before, but the point in looking at them here again is to look beneath the surface of the overall Transportation Index in an attempt to see if there is any sign of weakness that could serve to give us a heads up on any Dow theory developments that may be potentially trying to materialize. Since we last reviewed these charts, there have indeed been further signs of weakness within these sectors. But, the key is whether or not the setup surrounding the DNA Marker appears.
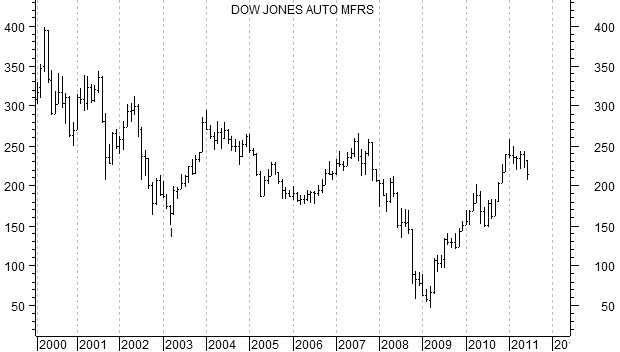
Let's now look at a couple of other sectors. The next chart we have is of the Dow Jones Auto Manufactures. This is a monthly chart and as you can see, it has moved to a new low for the year.
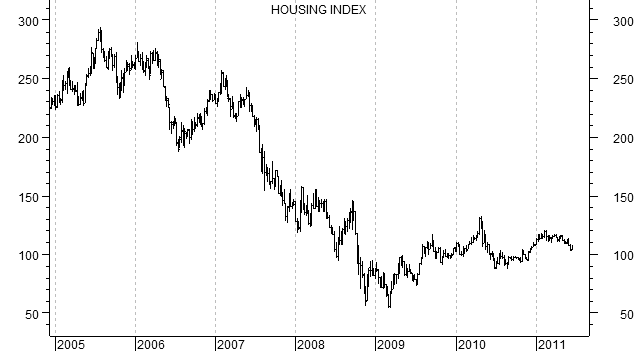
Next, is a monthly chart of the Housing Index. In this case, the high point for the advance out of the 2009 low has thus far occurred in April 2010. The high for this year was seen in February and like the Auto Manufactures has moved to new lows for the year.
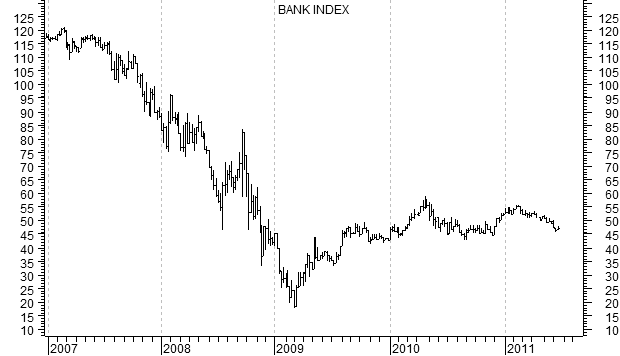
Just for fun, let's look at the Dow Jones Banking Index. Here too, a low was made in March 2009. But, thus far, the high for the advance out of that low has occurred in April 2010. In this case, the high for 2011 was seen in February and like the House and Auto Indexes above, it too has moved to new lows for the year. How can we be in a sustainable "recovery" with such key sectors showing this kind of weakness?
I have begun doing free market commentary that is available at www.cyclesman.info/Articles.htm The specifics on Dow theory, my statistics, model expectations, and timing are available through a subscription to Cycles News & Views and the short-term updates. I have gone back to the inception of the Dow Jones Industrial Average in 1896 and identified the common traits associated with all major market tops. Thus, I know with a high degree of probability what this bear market rally top will look like and how to identify it. These details are covered in the monthly research letters as it unfolds. I also provide important turn point analysis using the unique Cycle Turn Indicator on the stock market, the dollar, bonds, gold, silver, oil, gasoline, the XAU and more. A subscription includes access to the monthly issues of Cycles News & Views covering the Dow theory, and very detailed statistical-based analysis plus updates 3 times a week.
By Tim Wood
Cyclesman.com
© 2011 Cycles News & Views; All Rights Reserved
Tim Wood specialises in Dow Theory and Cycles Analysis - Should you be interested in analysis that provides intermediate-term turn points utilizing the Cycle Turn Indicator as well as coverage on the Dow theory, other price quantification methods and all the statistical data surrounding the 4-year cycle, then please visit www.cyclesman.com for more details. A subscription includes access to the monthly issues of Cycles News & Views covering the stock market, the dollar, bonds and gold. I also cover other areas of interest at important turn points such as gasoline, oil, silver, the XAU and recently I have even covered corn. I also provide updates 3 times a week plus additional weekend updates on the Cycle Turn Indicator on most all areas of concern. I also give specific expectations for turn points of the short, intermediate and longer-term cycles based on historical quantification.
Tim Wood Archive |
© 2005-2022 http://www.MarketOracle.co.uk - The Market Oracle is a FREE Daily Financial Markets Analysis & Forecasting online publication.