


Why Silver Could Drop Below $30
Commodities / Gold and Silver 2011 Jun 30, 2011 - 07:42 AM GMTBy: Dr_Nu_Yu

 A close look at where silver is currently positioned at this stage of its developing long-term bubble, and what can be expected short-term in its price using Bump-and-Run and Dead-cat Bounce pattern analyses, suggests that silver is on its way to returning to its long-term mean.
Where is Silver Positioned in This Bubble?
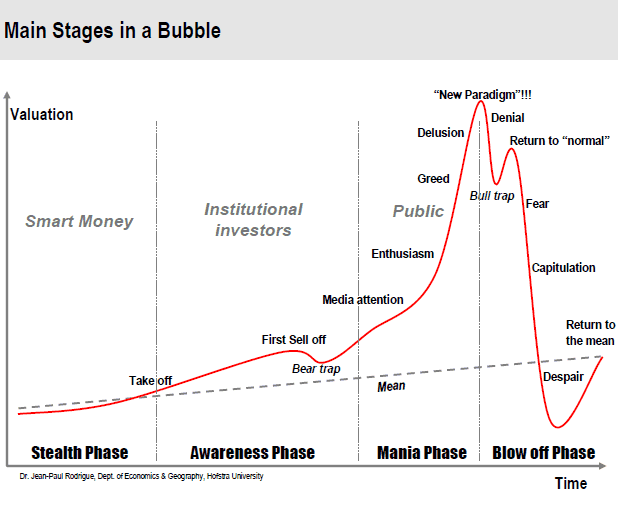
As shown below, it might be interesting to compare the silver chart with this graph of "Main Stages in a Bubble" by Dr. Jean-Paul Rodrigue. It shows that, after a brief "return to normal", silver is now moving into the "fear" area of the Blow off Phase as it "returns to the mean."
What is the Bump-and-Run Pattern Saying about the Short-term Price for Silver?
A Bump-and-Run pattern typically occurs when excessive speculation drives prices up steeply. According to Thomas Bulkowski, this pattern consists of three main phases:
- A lead-in phase in which a lead-in trend line connecting the lows has a slope angle of about 30 degrees. Prices move in an orderly manner and the range of price oscillation defines the lead-in height between the lead-in trend line and the warning line which is parallel to the lead-in trend line.
- A bump phase where, after prices cross above the warning line, excessive speculation kicks in and the bump phase starts with fast rising prices following a sharp trend line slope with 45 degrees or more until prices reach a bump height with at least twice the lead-in height. Once the second parallel line gets crossed over, it serves as a sell line.
- A run phase in which prices break support from the lead-in trend line and plunge lower in a downhill run.
As shown in the chart as of 6/28/2011 below, silver has been developing an intermediate-term Bump-and-Run pattern since last September. It only recently broke support from the lead-in trend line and entered into the Run phase to plunge lower in a downhill run last week.
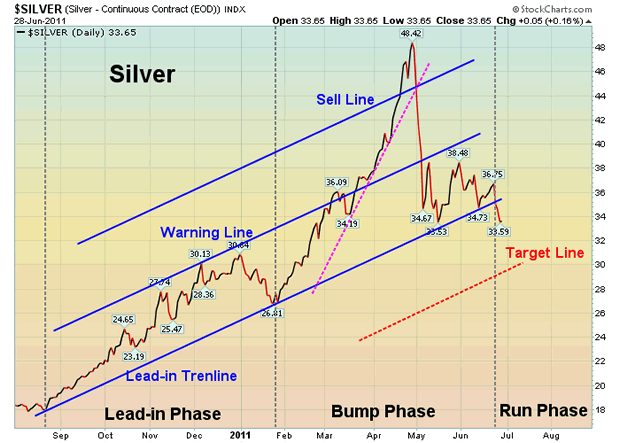
The next downside price target is projected at around $29/ozt. by the target line which is parallel to the lead-in trend line and is distant from the lead-in trend line with the same lead-in height.
What is the Dead-Cat Bounce Pattern Saying about the Short-term Price for Silver?
In addition to being in the run phase of the Bump and Run pattern silver is in a Dead-Cat Bounce pattern. A Dead-Cat Bounce pattern has three major phases:
- An initial plunge phase during which a sharp decline of 25% to 45% is experienced over several days.
- A bounce phase during which there is a short-term recovery of between 15% and 35% in 1-5 weeks.
- A post-bounce decline phase during which there is a slow decline over a 2-10 week period to a low somewhere between 15% and 45% below the bounce top.
What's Next for Silver?
Silver experienced:
- the initial plunge phase in early May with a decline of 31% (i.e. from $48.42 to $33.53) and
- the bounce phase at the end of May going up 15% (i.e. from $33.53 to $38.48).
The post-bounce decline phase has been ongoing since the early part of June and has the potential to drop 15% to 30%. A 25% drop would, incidentally, bring the price of silver down to $29/ozt. which would be in keeping with the abovementioned Run phase of the Bump and Run pattern.
Conclusion
The above chart patterns suggest that silver could drop below $30 per troy ounce soon on its return to its long term mean. It is the time to re-check fundamentals, reality, and risk for silver when Fed's QE2 ends.
If you found the above article of interest, you may wish to read my Market Weekly Update on gold, silver, the U.S. dollar and the S&P 500 by going here.
Dr. Nu Yu (fx5186.wordpress.com/), co-founder and president of Numarkan Investments and an affiliate of the Market Technician Association, is a frequent contributor to www.munKNEE.com
Visit http://www.FinancialArticleSummariesToday.com, “A site/sight for sore eyes and inquisitive minds”, and www.munKNEE.com, “It’s all about MONEY”, where you can sign up for their FREE weekly "Top 100 Stock Market, Asset Ratio & Economic Indicators in Review."
© 2011 Copyright Dr. Nu Yu - All Rights Reserved
Disclaimer: The above is a matter of opinion provided for general information purposes only and is not intended as investment advice. Information and analysis above are derived from sources and utilising methods believed to be reliable, but we cannot accept responsibility for any losses you may incur as a result of this analysis. Individuals should consult with their personal financial advisors.
© 2005-2022 http://www.MarketOracle.co.uk - The Market Oracle is a FREE Daily Financial Markets Analysis & Forecasting online publication.