


Washington Had a Spending Problem
Economics / Government Spending Jul 27, 2011 - 05:25 AM GMTBy: Paul_L_Kasriel

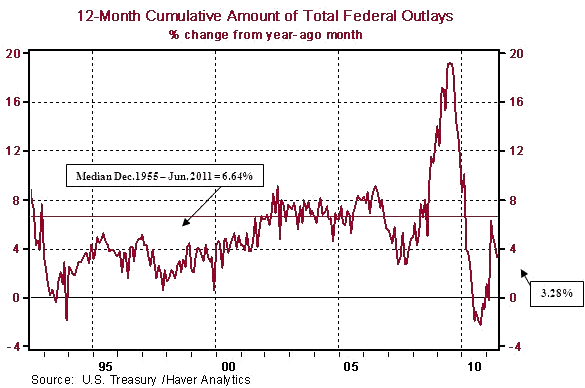
 But does it have one now and through 2017? In an historical context, no. Consider Chart 1, which shows the rate of growth in the 12-month cumulative amount of total federal outlays from year-ago month. In the 12 months ended June 2011, total federal outlays are up 3.28% from 12 months ended June 2010 -well below the 6.64% median growth in this 12-month cumulative total from December 1955 through June 2011. So, Washington hardly has a spending problem now vs. history.
Chart 1
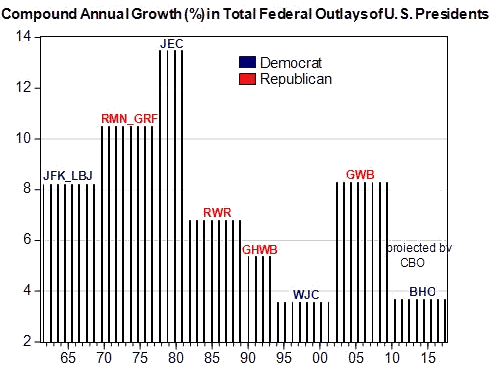
Although Washington does not seem to have a current spending problem, what about a spending problem going forward? Specifically, if the programs specified in President Obama's February 2011 budget proposal were implemented, how would growth in federal total outlays in an eight-year Obama presidential tenure compare with growth in federal total outlays of other presidents' tenures? To answer this question, I have relied on projections of total federal outlays by the Congressional Budget Office (CBO), the nonpartisan "scorekeeper" of all things fiscal. Chart 2 shows the compound annual rates of growth in total federal expenditures of presidential tenures beginning with the Kennedy-Johnson eight-year tenure. Because an incoming president essentially inherits the budget of his predecessor, I have started the growth clock in the second year of a presidency and kept it running through the first year of the next president.
For example, the clock for federal outlays for President George Walker Bush started with fiscal year 2002 and ran through fiscal year 2009. Although I am not making any predictions about the outcome of the 2012 presidential election, because the CBO has projected federal outlays through what would be another full term for President Obama (and beyond) and because of claims that under President Obama's budget proposal federal spending is a "problem," I have assumed in the growth calculations another full term for President Obama. So, Obama's federal-spending clock starts with fiscal year 2010 and runs through fiscal year 2017. In the presidential terms starting with Kennedy-Johnson, growth in federal total outlays was the fastest under President Carter (JEC) with a four-year compound annual rate of growth of 13.46%. The slowest growth in federal total outlays occurred during President Clinton's (WJC) term with an eight-year compound annual rate of growth of 3.55%. Given actual fiscal year 2010 outlays and CBO projections through 2017 based on President Obama's budget proposal of February 2011, the compound annual rate of growth in federal total outlays in the eight years ended 2017 would be 3.65%, just 10 basis points above that of President Clinton's eight-year presidential tenure.
Chart 2
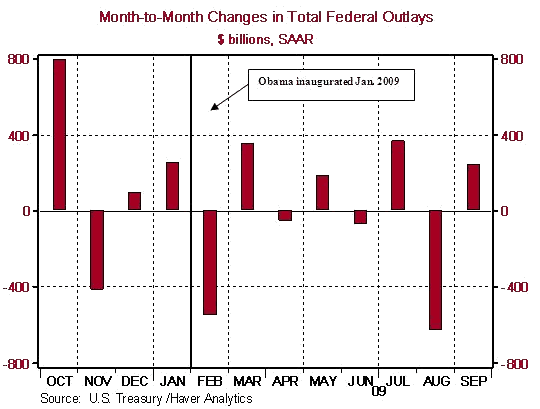
Lest you think that I rigged the data in favor of President Obama by assigning the total federal outlays in fiscal year 2009 to President George Herbert Walker Bush, the fact is that there were some very large federal outlays, such as those related to TARP in October 2008, that occurred prior to President Obama's inauguration in late January 2009 (see Chart 3). Bear in mind the federal government's fiscal year begins in October and ends the following September.
Chart 3
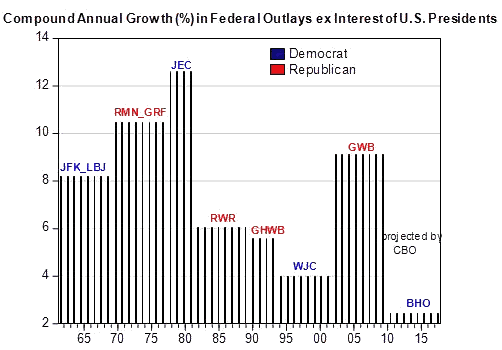
In part because of the nine consecutive federal budget deficits run starting in fiscal year 2002, cumulating to $4.84 trillion, interest on the federal debt is projected to be the fastest growing major component of federal outlays. Chart 4 shows the compound annual rate of growth of federal outlays excluding interest on the debt by presidential tenure. In the eight years ended fiscal year 2017, federal outlays excluding interest on the debt is projected to grow at a compound annual rate of 2.43%, the slowest, by far, during any presidential tenure starting with the Kennedy-Johnson presidency.
Chart 4
Although when considering CBO and anyone else's projections of federal outlays for the next several decades beyond fiscal 2017, it is correct in saying that Washington does have a spending problem, largely because of baby-boomer entitlement expenditures and interest on the debt. But looking at growth in current federal outlays and projections out through fiscal year 2017, it seems to be hyperbolic to say that Washington currently or in the next six fiscal years has a spending problem.
I appreciate the notion that presidents do not have complete control of the amount of expenditures that occur during their tenures. Although presidents submit budget proposals, Congress authorizes expenditures. So, it might be inappropriate to demarcate growth rates in federal outlays by presidential tenure. The fact (or CBO projection) remains, however, the current growth rate and projected growth rate through fiscal year 2017 in federal outlays are restrained in an historical context.
Paul Kasriel is the recipient of the 2006 Lawrence R. Klein Award for Blue Chip Forecasting Accuracy
by Paul Kasriel
The Northern Trust Company
Economic Research Department - Daily Global Commentary
Copyright © 2011 Paul Kasriel
Paul joined the economic research unit of The Northern Trust Company in 1986 as Vice President and Economist, being named Senior Vice President and Director of Economic Research in 2000. His economic and interest rate forecasts are used both internally and by clients. The accuracy of the Economic Research Department's forecasts has consistently been highly-ranked in the Blue Chip survey of about 50 forecasters over the years. To that point, Paul received the prestigious 2006 Lawrence R. Klein Award for having the most accurate economic forecast among the Blue Chip survey participants for the years 2002 through 2005.
The opinions expressed herein are those of the author and do not necessarily represent the views of The Northern Trust Company. The Northern Trust Company does not warrant the accuracy or completeness of information contained herein, such information is subject to change and is not intended to influence your investment decisions.
Paul L. Kasriel Archive |
© 2005-2022 http://www.MarketOracle.co.uk - The Market Oracle is a FREE Daily Financial Markets Analysis & Forecasting online publication.