Most Popular
1. It’s a New Macro, the Gold Market Knows It, But Dead Men Walking Do Not (yet)- Gary_Tanashian
2.Stock Market Presidential Election Cycle Seasonal Trend Analysis - Nadeem_Walayat
3. Bitcoin S&P Pattern - Nadeem_Walayat
4.Nvidia Blow Off Top - Flying High like the Phoenix too Close to the Sun - Nadeem_Walayat
4.U.S. financial market’s “Weimar phase” impact to your fiat and digital assets - Raymond_Matison
5. How to Profit from the Global Warming ClImate Change Mega Death Trend - Part1 - Nadeem_Walayat
7.Bitcoin Gravy Train Trend Forecast 2024 - - Nadeem_Walayat
8.The Bond Trade and Interest Rates - Nadeem_Walayat
9.It’s Easy to Scream Stocks Bubble! - Stephen_McBride
10.Fed’s Next Intertest Rate Move might not align with popular consensus - Richard_Mills
Last 7 days
Psychologically Prepared for Bitcoin Bull Market Bubble MANIA Rug Pull Corrections 2024 - 8th May 24
Why You Should Pay Attention to This Time-Tested Stock Market Indicator Now - 8th May 24
Copper: The India Factor - 8th May 24
Gold 2008 and 2022 All Over Again? Stocks, USDX - 8th May 24
Holocaust Survivor States Israel is Like Nazi Germany, The Fourth Reich - 8th May 24
Fourth Reich Invades Rafah Concentration Camp To Kill Palestinian Children - 8th May 24
THE GLOBAL WARMING CLIMATE CHANGE MEGA-TREND IS THE INFLATION MEGA-TREND! - 3rd May 24
Banxe Reviews: Revolutionising Financial Transactions with Innovative Solutions - 3rd May 24
MRNA - The beginning of the end of cancer? - 3rd May 24
The Future of Gaming: What's Coming Next? - 3rd May 24
What is A Split Capital Investment Trust? - 3rd May 24
AI Tech Stocks Earnings Season Stock Market Correction Opportunities - 29th Apr 24
The Federal Reserve's $34.5 Trillion Problem - 29th Apr 24
Inflation Still Runs Hot, Gold and Silver Prices Stabilize - 29th Apr 24
GOLD, OIL and WHEAT STOCKS - 29th Apr 24
Is Bitcoin Still an Asymmetric Opportunity? - 29th Apr 24
AI Tech Stocks Earnings Season Opportunities - 28th Apr 24
S&P Stock Market Detailed Trend Forecast Into End 2024 - 25th Apr 24
US Presidential Election Year Equity Performance in the Presence of an Inverted Yield Curve- 25th Apr 24
Stock Market "Bullish Buzz" Reaches Highest Level in 53 Years - 25th Apr 24
Managing Your Public Image When Accused Of Allegations - 25th Apr 24
Friday Stock Market CRASH Following Israel Attack on Iranian Nuclear Facilities - 19th Apr 24
All Measures to Combat Global Warming Are Smoke and Mirrors! - 18th Apr 24
Cisco Then vs. Nvidia Now - 18th Apr 24
Is the Biden Administration Trying To Destroy the Dollar? - 18th Apr 24
S&P Stock Market Trend Forecast to Dec 2024 - 16th Apr 24
No Deposit Bonuses: Boost Your Finances - 16th Apr 24

Market Oracle FREE Newsletter

How to Protect your Wealth by Investing in AI Tech Stocks

An Acceleration in Gold Price Trend has Begun

Commodities / Gold and Silver 2011 Aug 09, 2011 - 05:33 AM GMT

By: Jordan_Roy_Byrne

Commodities

In recent months we've been talking and writing about a potential acceleration in Gold. The chart said we were close and in all honesty Gold has actually been in a state of gradual acceleration since the 2008 low. Furthermore, we'd noted that in most secular bull markets, accelerations usually begin in the 11th or 12th year and are totally obvious by the end of the 13th year. Given the move of the past five weeks, there is no reason to think otherwise. An acceleration in the bull market has begun and will take Gold to $2000/oz and quite a bit higher in the next 18 months.


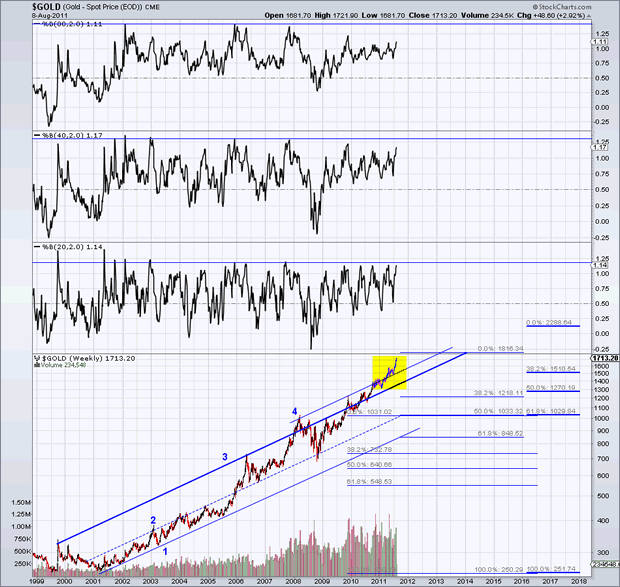
In the chart below we show four different but parallel trendlines. Trendlines one and two contained the bull market from 2001 to 2005 while trendlines two and three contained the bull market from 2006 to early 2010. Since then the market has tried to break and hold above trendline four. It happened in April of this year and the recent low was a successful retest of the breakout. Secondly, we'd like to point out the strong Fibonacci targets at $1820 and $2300.

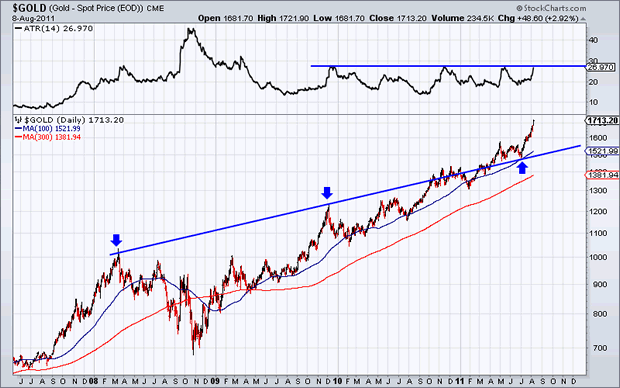
The next chart is a zoomed in look of the fourth trendline which connects the 2008 and 2009 highs and the June 2011 low. The top indicator is a volatility indicator. If it breaks higher then it could signal the start of parabolic move. Gold now has strong support at $1580 to $1600. A $100 or even $150 pullback wouldn't change the current state of acceleration.

Sentiment has become more bullish but that is only a reflection of an acceleration in a raging bull market. More and more will pile in and the trend accelerates but so to does volatility. Readers are advised to increase positions on pullbacks and to consider the gold and silver shares which are setting up for a fantastic 2012 and 2013.

If you’d like to learn more about how to profit, manage risk and have a professional guide you, then you can learn more about our service here.

Good Luck!

Jordan Roy-Byrne, CMT

Trendsman@Trendsman.com

Subscription Service

Trendsman” is an affiliate member of the Market Technicians Association (MTA) and is enrolled in their CMT Program, which certifies professionals in the field of technical analysis. He will be taking the final exam in Spring 07. Trendsman focuses on technical analysis but analyzes fundamentals and investor psychology in tandem with the charts. He credits his success to an immense love of the markets and an insatiable thirst for knowledge and profits.


© 2005-2022 http://www.MarketOracle.co.uk - The Market Oracle is a FREE Daily Financial Markets Analysis & Forecasting online publication.


Post Comment

Only logged in users are allowed to post comments. Register/ Log in