US Consumer Confidence Heads South Signaling Recession
Economics / US Economy Dec 05, 2007 - 01:07 AM GMTBy: John_Mauldin

 In the second installment of our special two day Outside the Box letter, we have good friend Greg Weldon's giving us his thoughts in his regular "Weldon's Money Monitor." Consumer expenditures account for approximately 2/3rds of
U.S. GDP. A precursor to any underlying changes in consumer expenditures is consumer sentiment. Greg explains to us the state of the American consumer and how current federal and institutional initiatives will not help thwart the looming recession. You can read his work at www.weldononline.com .
John Mauldin, Editor
Outside the Box
US Consumer Confidence Heads South
MACRO-US: Old School meets New School ... and the "Slope-off-Stimulus"
By Gregory T. Weldon
This is no small statement.
Check out the data extracted from the November Conference Board Consumer Confidence Survey results:
Consumer, 6-Month Forward Expectations ...
Percent Expecting Worse Conditions ...... 16.7% ... versus 13.9% in October.
Percent Expecting Better ...
... 12.4% ... down from 14.0% in October.
Hence, for the first time in many moons, the resilience in six-month expectations has finally vaporized, with the forward view having turned negative, 'officially' ...
Differential, Better versus Worse ... (-) 4.3 percentage... a 'complete' reversal from the positive + 0.1% seen in Oct.
In particular, 'expectations' as they relate to the forward outlook for the US labor market ... are 'tilting' hard to the downside:
Percent Expecting More Jobs Available, 6-Months ...... 10.8% ... dropping significantly from October's reply of 13.3%
Percent Expecting Fewer Jobs Available, 6-Months ... 23.1% ...
... soaring from October's already high 20.2%.
In other words, MORE than TWICE as many US consumers expect an outright contraction in the labor market, than expect job growth.
Note the differential:
Differential, Job Growth versus Loss ... (-) 12.3 percentage points,...nearly DOUBLING from Octobers already negative (-) 6.9% 'diff'
The consumer is going ON TILT, which very well COULD translate into an even SLOWER pace of expenditure growth, if not an outright contraction.
Witness the erosion in consumer expectations as per INCOME, amid thoughts of intensified job loss:
Percent Expecting Income to Decrease ... 11.0% ...... spiking into double-digits from October's 9.1% reply
And of course, the hard core evidence implies that the consumer is ALREADY 'retrenching', mentally, going forward, as the 'cocoon' begins to spin. We shine the spotlight on the revelation that the Number of People Planning on Buying a Home or Automobile in the next 6-Months ... fell ... in November.
It appears that the number of people planning on buying a 'recreation vehicle' has PLUNGED, and that this dynamic 'should' be viewed OMINOUSLY, on a past-experience basis, in terms of the odds that the US is heading into an outright recession.
With the industry gathering inn Louisville Kentucky, we get some valuable insight from a dissection of the data stream flowing like blue grass:
The share price of ALL five of the largest RV manufacturers-sellers are DOWN this year, led by Coachman, down (-) 52% YTD, and Winnebago, down (-) 37% this year.The company Thor, who has not had a single year of share price decline since it was first listed in 1986 ... is down (-) 23% YTD.
RV "Shipments" will decline this year, for the first time since 2000, and are down by a DEEPLY negative double-digit rate of (-) 11.1% thru the end of September. Of 86 Dealers attending the show, 66 said they would order fewer trailers and motor homes.
A beginning of the year Forecast published by the University of Michigan, anticipating 2007 sales growth of +3.5%, was revised to reflect expectations of a decline in sales, by a sizable (-) 4.8% in '07
Man, that is one UGLY 'revision' !!!!
OUCH, according to the industry, a decline in RV sales has preceded each of the last three major US economic recessions.
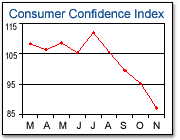
No wonder, when we rewind to highlight the headline Conference Board Consumer Confidence Index, as seen in the chart below extracted from their web-site. We note the September downside violation of the double-low set in June-and-August at 105 ... and the DEPTH of the four-month plunge.
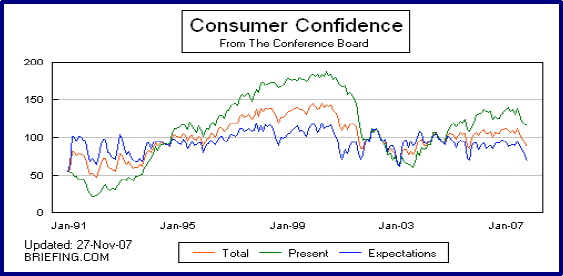
Observe the bigger-picture decline in US Consumer Confidence as evidenced in the long-term chart on display below, courtesy of briefing.com . Upon a perusal of this chart we immediately ask ourselves ... could the PRESENT condition 'collapse' in a way similar to 2000-01, and close the gap to an Expectations index that is making a new multi-year low, AND accelerating to the downside
We have already carved up the data to reveal an intensifying erosion within the US manufacturing sector ... and now we see signs to suggest that the much-championed, continued reflation in capital spending, will NO LONGER provide a 'support' to the macro-eco-situation in the US.
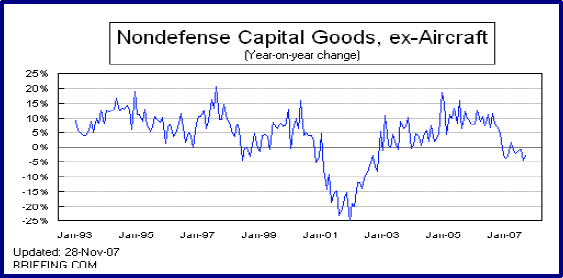
Specifically, we spotlight the DEEP decline in Core Capital Goods revealed in the Durable Goods report for October. Note the dissected data-details:
Capital Goods Orders, ex-Defense, ex-Aircraft ... down (-) 2.3%, wiping out three months worth of expansion in one-slice of the data-scalpel ... and ... maintaining a year-year DEFLATION, pegged at minus (-) 1.2%Evidence the chart below, and the collapse in this (previously) robust 'leading' indicator of US capex.
So it seems a LOGICAL question to ask ... why is LIBOR ... not ... 'following' the lead of the US Treasury market, as it pertains to forward expectations for easing to be enacted by the Federal Reserve Bank ?????
WHY does the chart below, plotting the path of 1-Month LIBOR against the path of the 2-Year Treasury Note's yield, exhibit a GREAT degree of 'divergence', since the middle of last year, and most acutely since August ??
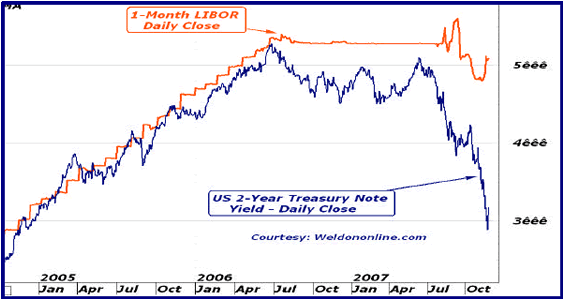
WHY, when the historical relationship has been MEGA-TIGHT, for YEARS, and has been tight during periods when rates were generally rising, and during rate declines ... as noted in the weekly chart below.
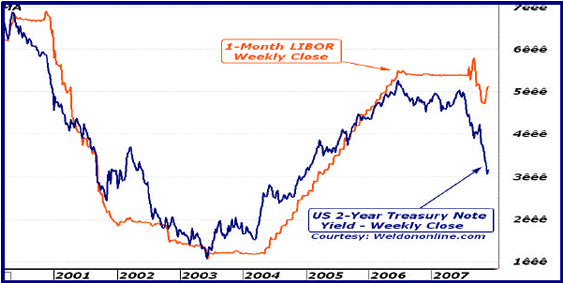
Perhaps MOST interesting is the most recent 'action', as 1-Month LIBOR has stopped falling, and has turned back to the upside while spiking back above 5% ... amid a plunge in the Treasury yield to a NEW MOVE LOW !!!
And moreover ... WHY is this dynamic being viewed BULLISHLY by the US equity market ???
To try and answer the last question first, we suggest that the rise in LIBOR is the REASON why the Fed Funds market has taken flight, with the forward thought now implying increased odds of a FIFTY basis point December Fed Funds rate reduction.
However, the rise in LIBOR is far more 'telling', and the macro-market message the divergence evidenced within the overlay charts on the previous page is OMINOUS, and suggests that the Fed might NOT be able to catch up with the 'credit-crunch-curve'.
Indeed, we have reached an HISTORIC 'pivot-point' as it relates to our longest-standing macro-secular 'theme' defined as the 'Secular Spectrum Stretch', wherein the global imbalances are maintained at both ends of the 'spectrum' ... credit-created-consumption growth in the US, and the resultant Asian-global export and income expansion.
A debate is RAGING, as to how to 'proceed' from this point.
The 'old-school' suggests that a recession is a necessary evil, and that the US consumer (hence, the entire global economy) has 'lived' too far above its 'means', via a credit bubble, that must be 'deflated' to some extent.
Old school says ... let some air out of the balloon, its necessary.
Old school professors point to the gold standard, and the 'distance' we have 'traveled', monetarily, AWAY from anything resembling any kind of 'standard', and therein lies the problem.
Old school is right, case closed.
We have examined the top-down old-school side of the debate, at length, in the book Gold Trading Boot Camp.
Old school is right, case closed.
BUT, BUT, BUT ... that is NOT to say that old-school solutions should be applied, as the 'answer'.
In fact, in the book we state, clearly, that the time for 'academic-solutions' has LONG PAST, and that human nature will take over.
Indeed, human nature, and the drive towards pain avoidance as a basic survival instinct, represents ... the new school.
The reflation bubble MUST be sustained, say new school professors.
Indeed, NEW SCHOOL is ... RIGHT TOO !!!!
Given the historic highs reached in credit since the last 'paydown-defined' recession (1990-91), a credit contraction, once it begins, could implode, and cause an outright 'debt-deflation'.
The risk of this scenario, is more frightening than a scenario where the prices ALL asset (ie: collateral) continue to reflate.
Thus our comments, when peering into the abyss of an outright debt deflation, human nature will drive ANY central banker, to choose reflation.
In other words, global monetary authorities, particularly the Fed, have shown a distinct propensity to err on the side or reflation, and to acquiesce to signs of 'inflation' in things like oil, gold, and food ... in order to AVOID the horrific pain that a debt deflation would cause.
Monetary authorities are always looking for the optimum slope of stimulus.
The problem is ... what if ... that slope becomes vertical, and there is NO response in terms of extending the secular trend of credit creation.
What if ... Fed easing does not, ultimately, stop the mini-reversal towards a credit contraction !!!
Indeed, this might help explain WHY the Fed has NOT been more aggressive, slope-of-stimulus wise, already, for fear of spending too many bullets, too early in the macro-shoot-out now underway.
The simple fact that the US 2-Year Note is probing sub-3% yields, already, is disturbing in the sense that each tick lower indicates a far more intensified degree of Fed stimulus the market is suggesting is required ...
... to maintain an adequately 'steep' slope-of-stimulus.
For SURE ... the slope of growth in credit derivatives seems FAR STEEPER than the Fed is capable of 'handling', without a major monetary 'debasement'.
IF ... the slope-of-stimulus must match the slope revealed in the chart below, (courtesy of John Mauldin's Outside the Box e-letter) plotting the Notional Amount of Credit Derivatives Outstanding ...
... then the Fed is in BIG TROUBLE.
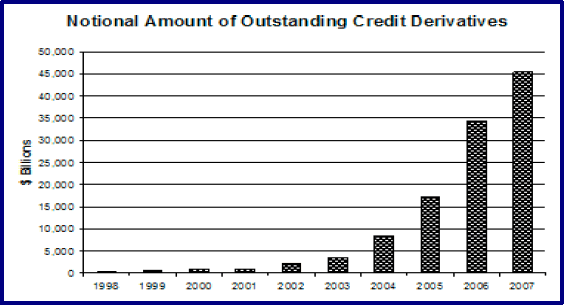
NOTE: since the MOST RECENT debt-paydown-defined recession in the US, during 1990-91 ... since then ... credit derivatives has SOARED from virtually NOTHING, to almost FIFTY TRILLION DOLLARS.
Indeed, since 2004 alone, credit derivatives have QUADRUPLED.
Indeed, of the near $46 trillion of derivatives outstanding, MORE than $40 trillion of that has been 'created' in just the last four years. Any significant correction to the short four-year trend would result in TENS of TRILLIONS of dollars in 'credit-contraction'.
OMINOUS then, is the thought that a major US bank had to pay a Middle Eastern government 11% for a mere $7.5 billion.
Timely to the max was yesterday's publication of the Federal Deposit Insurance Corporation's "All Institutions Report for Third Quarter 2007". This is one JAM PACKED report, with some of the most revealing, specific, and downright SCARY charts we have ever dissected. Scalpel in hand, we carve into the FDIC report to first note the following 'text', starting with the all- telling very first paragraph ...
... "Rising levels of troubled loans in all major loan categories, but most notably residential mortgage portfolios, led to a steep jump in expenses for bad loans in the third quarter. These higher costs, combined with sharply lower trading revenues caused industry earnings to fall 24.7 percent from a year ago, to the lowest level since the fourth quarter of 2002."Worse ...
... "The industry's return on assets (ROA) for the quarter was 0.92 percent, the lowest ROA since the fourth quarter of 1992."Because ...
... "Noncurrent loans and leases registered their largest quarterly increase in 20 years during the third quarter, rising by $16.0 billion ( 23.8 percent). At the end of September the total amount of loans and leases that were noncurrent stood at $83 billion, the highest level since the third quarter of 1992."As a result ...
... "Net charge-offs totaled $10.7 billion, the largest quarterly amount since the fourth quarter of 2002. Loan losses were up in most of the major loan categories (residential loans, home equity lines of credit, construction and development loans, and nonresidential property loans)."And subsequently ...
... "Loan-loss provisions totaled $16.6 billion, more than double the $7.5 billion insured institutions set aside for credit losses in the third quarter of 2006, and the largest quarterly loss provision for the industry since the second quarter of 1987."We see ... post-2000-01 (2002), post-1990-91 (1992) ... and ... 1987 ... were repeatedly cited by the FDIC as reflecting a similar macro-credit situation to that which exists currently.
Except ... this episode is only just beginning.
To think that $10 billion in net charge-offs, or a mere $16 billion increase in noncurrent loans ... implies that we are nearer the end of the current credit crunch, as opposed to the beginning, is to completely DISMISS the degree of growth in credit derivatives we just spotlighted ...
... and ... which is CLEARLY exposed within the FDIC report itself. First, we note the following passage ...
... "At the end of September, more than one in four institutions (27.4 percent) reported construction loan portfolios that exceeded their total capital."That ... is a BIG problem ... particularly given the most updated US housing statistics, which we will dissect later in today's Monitor.
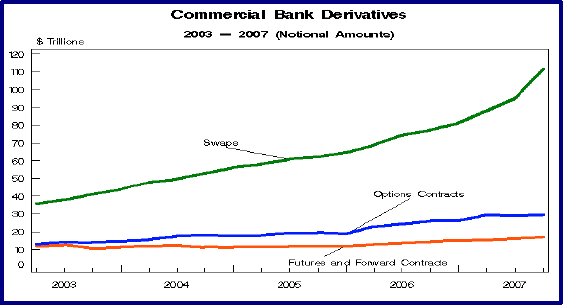
Then we note the following chart, revealing a near TRIPLING in the amount of Commercial Bank Swaps, which have exploded over the last five years, and even more so in the last five months ... growing from $35 billion, to more than $100 billion ... in swaps ALONE.
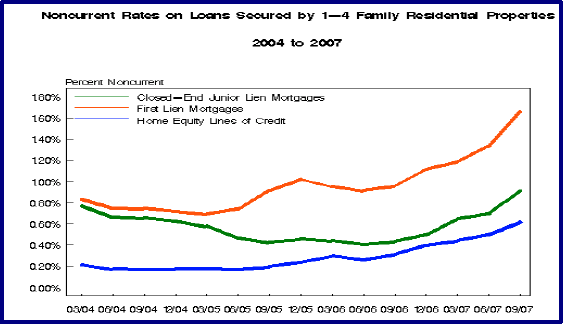
In terms of the loan performance data, we spotlight the chart below reflecting the upside spike in Noncurrent Loans secured by Residential Properties, lead higher by First Lien Loans ... with a noticeable, more recent upside acceleration in noncurrent Home Equity Lines of Credit.
Hence, the RealtyTrac data released this morning, revealing another HUGE increase in US Home Foreclosures, becomes an even UGLIER statistic:
US Foreclosures ... rose + 2.0% in the month of October, and are increasing at a +94.0% year-year rate.Indeed, foreclosures in the home of Sin City, Nevada rose +20.0% for the MONTH, and pushed the year-year rate of increase to more than +300% !!!!
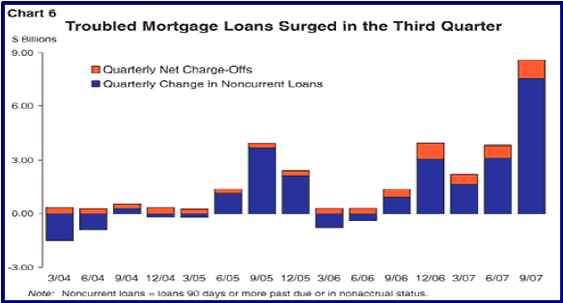
With upwards of $800 billion in Adjustable-Rate Mortgages prepared to 'reset' in the next 6-9 months ... the rise in 'troubled' mortgage loans in the 3Q seems SMALL, relative to what the future might bring. Note the chart below, and the spike to nearly $9 billion, easily DOUBLE the next highest quarterly total posted in the last four years.
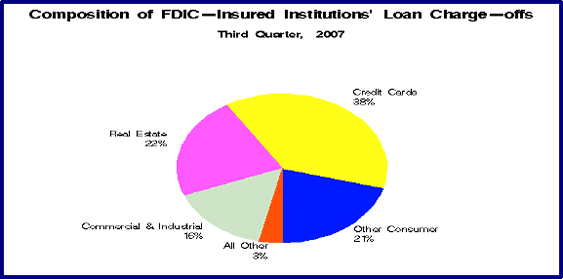
It seems ironic, given the high degree of exposure to mortgages ... that CREDIT CARDS represented the LARGEST 'contributor' to increased Loan Charge-offs during the 3Q, as defined in the pie chart below.
WORSE ... the rate of increase in credit-card write-offs was relatively subdued compared to the +46.1% year-year spike in charge-offs related to Consumer Loans other than Credit Cards.
Indeed, the proportion of total charge-offs caused by 'Other' Consumer Loans was nearly EQUAL to those posted by Real Estate related charge-offs.
Recall our recent Money Monitor focus on securitized debt created within the Auto Loan, and Consumer Credit sectors ... which are cumulatively worth more than a trillion dollars.
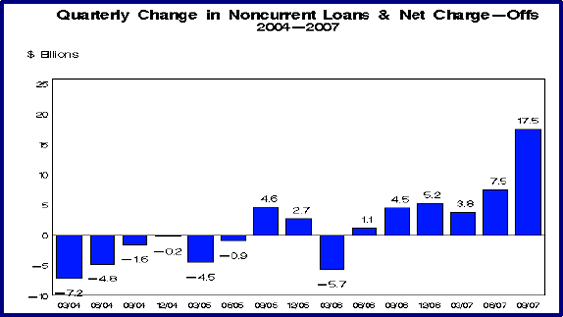
Observe the total change in non-current loans and net chart-offs posted during the 3Q, as evidenced in the chart below. We spotlight the most recent string of six straight quarters of increase, totaling nearly $40 billion, with the most recent quarterly expansion equal to nearly HALF of that cumulative total.
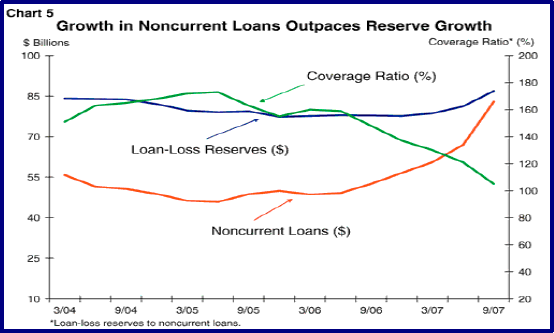
Worse, the continued rise in foreclosures implies a continued rise in noncurrent loans during the 4Q, which might tilt the balance in terms of the 'Coverage Ratio', measuring loan loss reserves relative to noncurrent loans.
As defined with the chart below, the gap between reserves and noncurrent loans has EVAPORATED, meaning that ANY and ALL further increase in non- performing loans ... will translate into a parallel rise in Loan Loss Reserves, since the 'normal' $20-$30 billion cushion is gone.
VOILA ... Loan-Loss Provisions spiked to their highest level since ... 1987.
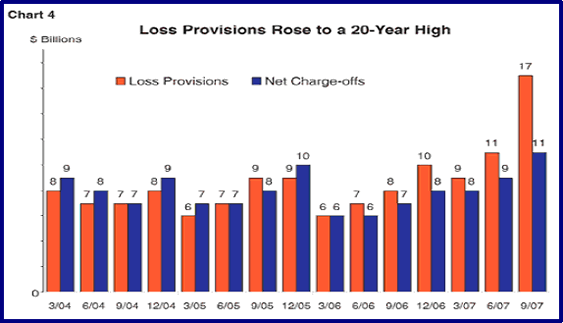
Perversely we can get a 'sense' of the massive 'scope' of the potential depth of this credit-derivative and loan-loss black hole ... by noting the chart above, with its MULTI-DECADE HIGH in Loan Loss Provisions ...
... against the chart on display below, plotting the current level of the Noncurrent Rate on Construction Loans, which has SPIKED in the last eighteen months, but remains HISTORICALLY LOW in the 2% range.
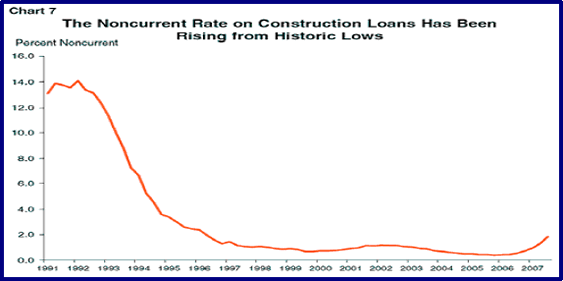
This is MOST DISTURBING in the context of the previously spotlighted comment from the FDIC as it relates to the MAMMOTH SIZED 'exposure' in US banks, to 'Construction and Development Loans'. Recall ...
... "At the end of September, more than one in four institutions (27.4 percent) reported construction loan portfolios that exceeded their total capital."The financial sector is hanging by a THREAD ... one that connects directly to the housing market.
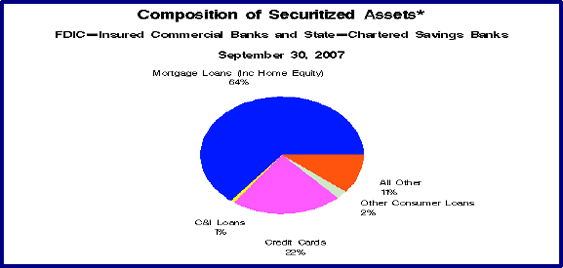
Evidence the fact that almost TWO-THIRDS of ALL Securitized Assets are linked to Mortgage Loans.
The phrase ... 'house-of-cards' comes to mind, particularly when we break out our trusty-data-scalpel and carve into the latest data on the US housing market, as defined by the Existing and New Home Sales reports released in the last two days. We specifically spotlight this dynamic as it relates to DEFLATION in prices, and future downward price pressure emanating from another spike in supply ... which is likely a catalyst to intensified foreclosures, noncurrent loan rates, and loan loss provision demands.
Existing Single-Family Median Home Price ... $205,700 ... its LOWEST level since 2004, down from $208,600 in September, having fallen by (-) $23,700 since June, a four-month deflation of (-) 10.3%.Existing Median Home Price ... down (-) 5.1% yr-yr, accelerating to the downside compared to the (-) 4.8% yr-yr pace of deflation posted in September, and sliding deeper into negative territory from the plus + 0.2% yr-yr gain seen as recently as August.
Existing Single-Family Homes for Sale ... 3,800,000 ... rising +100,000 during October alone, an increase of +2.7% ... and now having soared from 2,920,000 as of the end of last year, for a ten-month YTD increase of + 880,000.
Nearly a MILLION more existing homes are for sale compared to January, and, since June prices have COLLAPSED at an annualized rate of (-) 30%.
Oh, and Existing Home Sales fell to a NINE-YEAR LOW.
Subsequently, we shine the spotlight on the supply of unsold homes, relative to the current pace of sales:
Months of Sales, in Supply ... 10.5 months... an increase of +45.8% yr-yrMoreover, note the sequential build in unsold inventory, relative to sales:
Dec-06 ... 6.4Jan-07 ... 6.5
Feb-07 ... 6.5
Mar-07 ... 7.2
Apr-07 ... 8.2
May-07... 8.6
Jun-07 ...9.0
Jul-07 ... 9.2
Aug-07 ... 9.3
Sep-07... 10.1
Oct-07 ... 10.5
In line with intensifying pressure from the sale of repossessed homes, the rise in unsold supply is almost assuredly set to cause further price deflation.
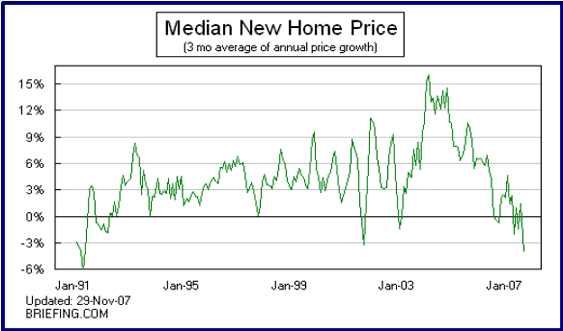
As for New Homes ... the chart below (courtesy of briefing.com ) speaks volumes, as we spotlight the plunge in New Home prices to a DEEPLY negative (-) 13.0% yr-yr pace of deflation, and the worst 3-Month annualized rate of loss since 1991, as defined in the chart.
Circling back to the FDIC data, we conclude by observing that a statistical detail that we have been SPOTLIGHTING since June, as bank deposit growth continues to FAIL to keep pace with growth in credit.
... "Domestic Deposit grew by $49.7 billion and deposits in foreign offices rose by $82.2 billion. This growth in deposits represented less than a third of the growth in total assets, which increased by a record $446.3 billion."Indeed, growth in Domestic Deposits was BARELY ONE-TENTH the growth in 'assets', almost singularly the result of credit creation, via an expansion in outstanding loans ($49.2 billion, versus $446.3 billion).
So, where are banks getting the money to loan ???
Note more of the FDIC report text ...
... "Insured institutions increased their reliance on wholesale funding sources."VOILA ... we come FULL CIRCLE ... to suggest that the above comment serves to explain WHY the One-Month LIBOR rate is NOT keeping pace to the downside, in line with the deep decline in the 2-Year Treasury Note yield.
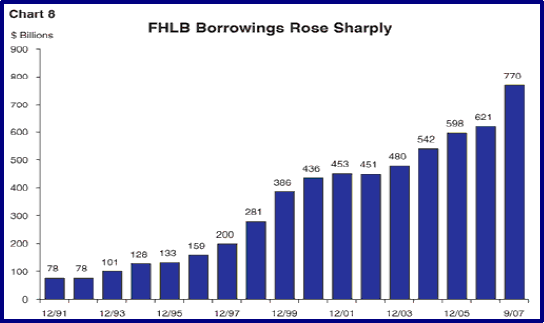
This also might well explain the TIDAL WAVE of borrowings from the Federal Home Loan Bank, or FHLB, a dynamic evidenced in the chart on display below, extracted from the FDIC report.
Since the last debt-paydown-defined recession (1990-91) ... borrowing from the Federal Home Loan Bank has risen by TEN TIMES, from $78 billion in 1991, to a whopping $770 billion, in just the first nine months of 2007.
Did someone say ... a house-of-cards ????
Yes, WE DID.
Financial shares rallied sharply on Wednesday, predicated upon thoughts that the Federal Reserve might ride their monetary white-horse to the rescue once again, with an aggressive 50 basis point rate cut in December.
Failure of the Fed to deliver on that intensified expectation could be highly problematic, from the perspective of the stock market, and as it relates to the thought that the Fed is falling further and further behind the credit- crunch curve.
At this point, even a 25 basis point cut in the Fed Funds will not satisfy the market, in terms of representing a slope-of-stimulus that is INADEQUATE, to spark another wave of reflation.
We may have already passed over what we have termed the 'Macro-Event- Horizon', or the point of no return. This is the point that, unknowingly at the time, we will have already entered the death grip of a debt-black-hole, a hole as massive as implied by the plethora of credit data detailed in today's Money Monitor. A black hole so fiercely imploding onto itself, that it will suck dry every drop of liquidity the Fed can create, and then some.
We will ONLY KNOW by looking backwards ... and by then, it will be too late.
Towards that end we have been acutely focused on the weekly report detailing the balance sheets of US Commercial Banks, which, to date, had NOT shown ANY clues as to an imminent downside reversal in bank lending. This, in part, because of balance sheet adjustments, and in part because 'regular' lending had not yet 'rolled-over'.
We have specifically spotlighted the impact of a MASSIVE increase in 'Other Securities' held by Commercial Banks, as banks have moved off-balance credit derivative holdings, onto their balance sheets.
We have dissected the data to reveal the trend, starting with a monthly increase of $5 billion in May, to the record monthly increase of more than $60 billion posted in for the month of October ...
... to the MIND-BLOWING size of the single week increase posted in the first week of November, at more than $60 billion.
For SURE ... loan loss reserves are set up to EXPLODE in the near-term.
And thus we have been waiting to see a decline in lending, as banks begin to retrench in the face of the balance sheet, noncurrent loan, and loan-loss reserve realities.
Indeed, the latest weekly data on the offer from the Fed reveals a continued RISE in bank lending, with gains posted in Revolving Home Equity, and Consumer Loans, with BIG gains in both, likely amid intensified household DISTRESS. Note the data-details:
Revolving Home Equity Loans ... $481.0 billion ... a NEW RECORD HIGH, and up by $1.1 billion in the latest week.Consumer Loans Outstanding ... $791.2 billion ... a NEW RECORD HIGH, and up by a FULL ONE PERCENT, via a HUGE single-week increase of $7.8 billion
Indeed, Consumer Loans expanded at an annualized pace exceeding FIFTY PERCENT, in the week ending November 14t.
The spectrum is stretched to the MAX ... and the slope-of-stimulus continues to STEEPEN.
We wonder, can the Fed climb the mountain one more time !!!???
BAH HUMBUG ... we remain bearish on the US equity indexes, and bullish on the short-end of the US fixed-income yield curve via the 2-Year Treasury Note ... expecting that the Fed will be forced to keep pushing, by intensified credit-crunch conditions, and further paper wealth deflation ...
... as 'old school' theories and 'new school' policies CLASH, in a battle for the ages.
Gregory T. Weldon ---
Your hoping the consumer remains resilient analyst,
By John Mauldin
http://www.investorsinsight.com
To subscribe to John Mauldin's E-Letter please click here: http://www.frontlinethoughts.com/subscribe.asp
Copyright 2007 John Mauldin. All Rights Reserved
John Mauldin is president of Millennium Wave Advisors, LLC, a registered investment advisor. All material presented herein is believed to be reliable but we cannot attest to its accuracy. Investment recommendations may change and readers are urged to check with their investment counselors before making any investment decisions. Opinions expressed in these reports may change without prior notice. John Mauldin and/or the staff at Millennium Wave Advisors, LLC may or may not have investments in any funds cited above. Mauldin can be reached at 800-829-7273.
Disclaimer PAST RESULTS ARE NOT INDICATIVE OF FUTURE RESULTS. THERE IS RISK OF LOSS AS WELL AS THE OPPORTUNITY FOR GAIN WHEN INVESTING IN MANAGED FUNDS. WHEN CONSIDERING ALTERNATIVE INVESTMENTS, INCLUDING HEDGE FUNDS, YOU SHOULD CONSIDER VARIOUS RISKS INCLUDING THE FACT THAT SOME PRODUCTS: OFTEN ENGAGE IN LEVERAGING AND OTHER SPECULATIVE INVESTMENT PRACTICES THAT MAY INCREASE THE RISK OF INVESTMENT LOSS, CAN BE ILLIQUID, ARE NOT REQUIRED TO PROVIDE PERIODIC PRICING OR VALUATION INFORMATION TO INVESTORS, MAY INVOLVE COMPLEX TAX STRUCTURES AND DELAYS IN DISTRIBUTING IMPORTANT TAX INFORMATION, ARE NOT SUBJECT TO THE SAME REGULATORY REQUIREMENTS AS MUTUAL FUNDS, OFTEN CHARGE HIGH FEES, AND IN MANY CASES THE UNDERLYING INVESTMENTS ARE NOT TRANSPARENT AND ARE KNOWN ONLY TO THE INVESTMENT MANAGER.
John Mauldin Archive |
© 2005-2022 http://www.MarketOracle.co.uk - The Market Oracle is a FREE Daily Financial Markets Analysis & Forecasting online publication.


