


How Bull Markets Evolve into Bubbles
Commodities / Gold and Silver 2012 Feb 10, 2012 - 05:03 AM GMTBy: Jordan_Roy_Byrne

 There is a science to market movements and various trends because human nature is consistent over time. Bear markets follow a pattern as do bull markets. In recent weeks we’ve noted the similarities between the past four equity bull markets. They start off strong for six or seven years before slowing down over the next five years. Then they break to new highs and eventually accelerate into a bubble. As we show in this update, change in valuation explains how bull markets evolve into bubbles.
The following chart shows the Nikkei (black) and its price to earnings ratio (blue). The chart comes from DailyWealth but the annotations are mine. In our opinion, the Japanese bull market began in the late 1960s. Note, from 1977-1983 the PE ratio trended down slightly, yet the market continued to rise. In other words, profits increased faster than the market (share prices). In 1983 the PE ratio broke to a new high and would move from 20 to over 70 in about five years.
Next is a chart of the Nasdaq’s price to earnings ratio, courtesy of InvestTech Research. The ratio declined from 1991-1995. It wasn’t until the end of 1996 that the ratio began to move to new highs. We cut off part of the chart as it was too tall due to the fact that the PE ratio eventually reached 260!
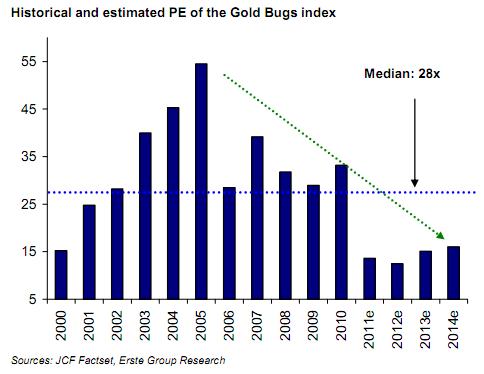
Where do the gold equities stand? This chart from the Erste Group, shows the PE ratio for the HUI Gold Bugs Index. This chart was produced in July 2011. Since then the HUI has declined slightly. The estimated PE for 2011 (less than 15) is close to reality. We do expect 2011 to be the bottom for the PE ratio. According to Yahoo Finance, the trailing PE ratio for GDX (large cap gold stocks ETF) is 10. After hitting a low, it took less than three years for the PE ratio for the Nasdaq and Nikkei to move to new highs.
Bull markets follow three stages. These are the initial stealth phase, the wall of worry phase and then the bubble or public participation phase. By now you should know we are in the wall of worry phase. The current valuation of gold stocks confirms that. Sentiment confirms that. After all, gold stocks have made little net progress in the last four years while Gold has nearly doubled in the same period. The mainstream continues to ignore the gold equities while most of the true supporters are doubting the future.
Yet this wall of worry phase is what sets the stage for the bubble phase. In this period, earnings increase faster than stock prices and it results in lower valuations and improved fundamentals. At the same time, sentiment from a contrary perspective becomes more compelling. Many investors bail out of the bull market in this period leaving the strong hands in control of a bull market that remains intact.
Remember, stock prices are a function of earnings and valuations. In the first phase of a bubble we see earnings rise and valuations move from a low to a high. In the second phase of a bubble, skyrocketing valuations are the primary driver of share price appreciation. Bubbles develop from a one-two punch of rising profits and rising valuations. Over the next several years, the PE for the gold stocks (currently 10) could easily move back to 2004-2005 levels. Combined with continued increases in profits, share prices would explode
If you'd like professional guidance in riding this bull market and uncovering the winning companies then consider learning more about our premium service.
Good Luck!
Jordan Roy-Byrne, CMT
Trendsman@Trendsman.com
Subscription Service
Trendsman” is an affiliate member of the Market Technicians Association (MTA) and is enrolled in their CMT Program, which certifies professionals in the field of technical analysis. He will be taking the final exam in Spring 07. Trendsman focuses on technical analysis but analyzes fundamentals and investor psychology in tandem with the charts. He credits his success to an immense love of the markets and an insatiable thirst for knowledge and profits.
© 2005-2022 http://www.MarketOracle.co.uk - The Market Oracle is a FREE Daily Financial Markets Analysis & Forecasting online publication.