


Stock Market More Sideways Consolidation Before A New High?
Stock-Markets / Stock Markets 2012 Mar 12, 2012 - 04:00 AM GMTBy: Andre_Gratian

 SPX: Very Long-term trend - The very-long-term cycles are down and, if they make their lows when expected (after this bull market is over) there will be another steep and prolonged decline into late 2014. It is probable, however, that the steep correction of 2007-2009 will have curtailed the full downward pressure potential of the 120-yr cycle.
SPX: Intermediate trend - The intermediate uptrend is still intact, but a short-term top is forming.
Analysis of the short-term trend is done on a daily basis with the help of hourly charts. It is an important adjunct to the analysis of daily and weekly charts which discusses the course of longer market trends.
Market Overview
After touching 1378, the SPX had its biggest correction since December 19, but it only lasted 4 days and was only 38 points. This was followed by a straight shot back up to within three points of the high. The QQQ even made a fractional new high.
With several cycles being active last week, it is difficult to attribute the market's action to any one in particular. Although I had expected a couple of minor cycles to make their lows on Tuesday and Wednesday, they must have had some assistance from a larger cycle in order to produce as strong a pull-back. The SPX broke the minor support level of 1353, but could not get beyond the more important one of 1340, which is the one that will have to be penetrated before we can have a protracted decline. With the kind of buying that was evident last week, it does not seem that we are ready to start on this journey.
Structurally, we could be in the midst of a shallow wave 4 correction from 1359 which could express itself as a flat or a triangle. We could make up the lack of depth in the pull-back by using up some time around this level before pushing higher. Unless it has already topped, next week the SPX should see a short-term high brought about by a cycle which has had a fairly consistent high-to-high phase for the past 3 years, but Monday should see the bottoming of a minor cycle - unless it inverts!
Whether or not the index makes a new marginal high should not alter the probability of a high level consolidation which has not yet run its course. There was a potential P&F projection to 1375 which was reached early on Friday, followed by a narrow consolidation for most of the day with a small dip into the close. Should the index decide to go a little higher next week, it could reach 1383.
The overall market ended the week with a mixed picture. The VIX retraced to the low of its base, ostensibly indicating that the market is not ready to have a serious correction, but UUP may be starting an uptrend. Also, XLF was strong, but SMH, RUT and DJIA were all lagging.
We'll see how all this plays out next week.
Chart analysis
As we can see on this Daily Chart, the SPX was progressing upward in the pale blue channel until it was broken on the downside by last week's sell-off. This had been expected for some time since there had been prolonged deceleration in prices as well as notable divergence in the indicator. This action represents a price transition from the steep and narrow channel to a more sustainable, wider (black) channel which should contain prices for a while longer. The validity of that new channel is evident! Look how prices were hugging the top line until bottoming short-term cycles finally caused them to break away from it. The 1340 level where prices came to rest happened to coincide with the channel median, making support that much stronger. (Note that this is only an interim channel. There are wider channels representing the intermediate and the long-term trends. The will all have to be broken before we get to the end of the bull market.)
On Friday, the SPX rallied to back-test the lower line of the blue channel. Whether it provides enough resistance to stop the rally remains to be seen. Because of the current market strength, the index could continue to trade in the upper half of its new channel. Breaking into the lower half would be the first sign of market weakness.
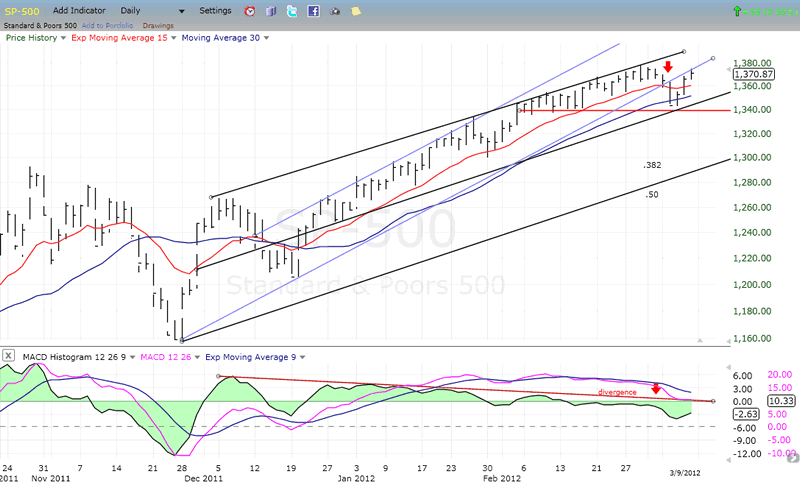
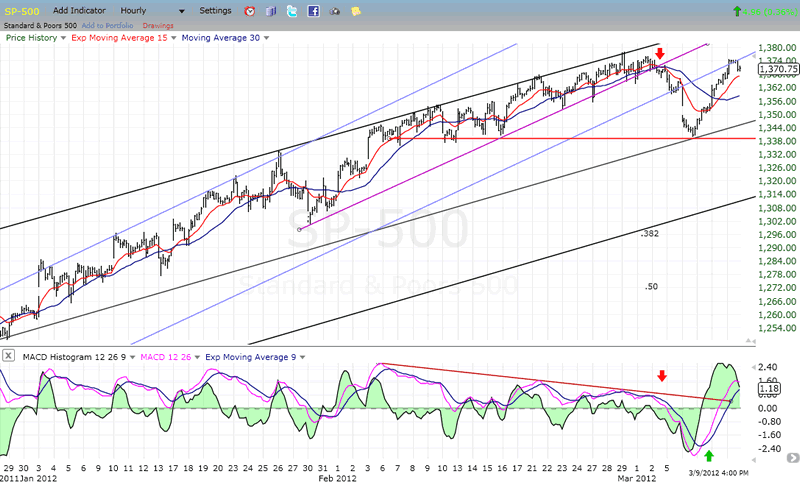
The Hourly Chart shows more clearly the blue channel break and the back-testing of its lower trend line. Since the downtrend line of the MACD has been broken and the histogram had such a large surge, the SPX may not retrace before the histogram develops some negative divergence, in which case, it would be almost certain that the index would make a new high before pulling back.
In any case, if the high-to-high cycle performs as it has in the past, it should bring about a near-term top, followed by a noteworthy pull-back.
Cycles
It will take a little while to determine if the 22-wk cycle made its low last week, and was responsible for the sharp pull-back and the following rally. If it has bottomed, it's a safe bet that the SPX will not linger at these levels for very long.
The next cycle to make its presence known should be the 13/14-wk high-to-high cycle, which could already have topped early, on Friday.
There is also a minor cycle low due Monday (unless it inverts) which could cause a small pull-back before the larger cycle makes its high.
Breadth
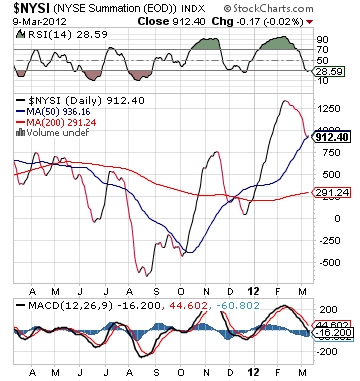
The NYSE Summation Index (courtesy of StockCharts.com) has pulled back to its 50-DMA where it could find support. More importantly, its RSI has gone from overbought to oversold and may be ready to turn up again which would put some upward pressure on the market.
Sentiment
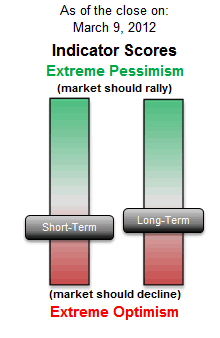
As a result of last week's decline, the SentimenTrader (courtesy of same) long-term indicator has become somewhat less negative, giving the market more room on the upside before it becomes susceptible to the next correction.
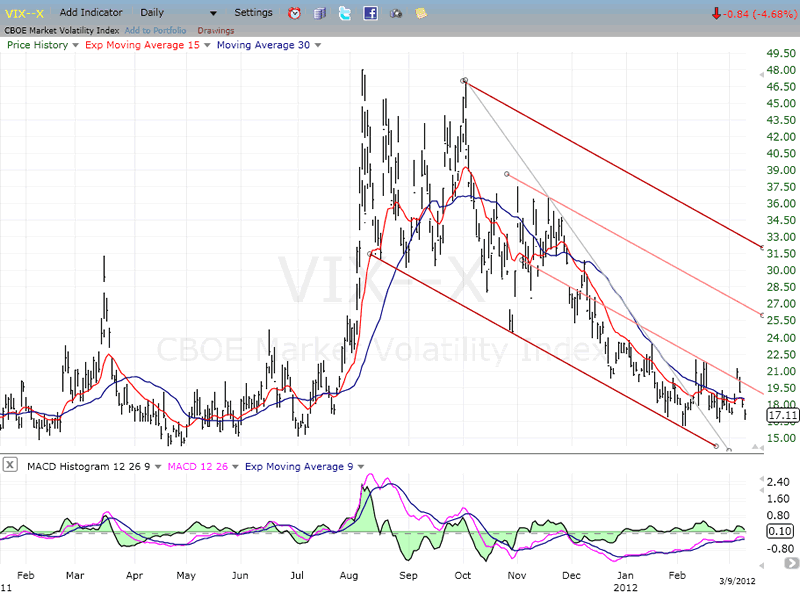
VIX
By retracing into the lower confines of its base, the VIX has also opened the way for higher market prices.
Since its decline from early October of last year, the index has been confined to a very wide channel which I have divided into three sections of approximately equal proportions. The internal trend line which marks the lower section has twice contained attempts at breaking out. Next time, it may be more successful. The MACD has continued to rise in spite of the set-backs, and the moving averages are beginning to flatten out, which means that another try cannot be too far off.
However, any attempt at moving out of the larger channel is most likely weeks if not months away. That should give us some idea about how long it will be before the bull market is ready to top out! The bears will have some minor opportunities along the way, as the market corrects, but they should not count on a major reversal anytime soon.
BONDS
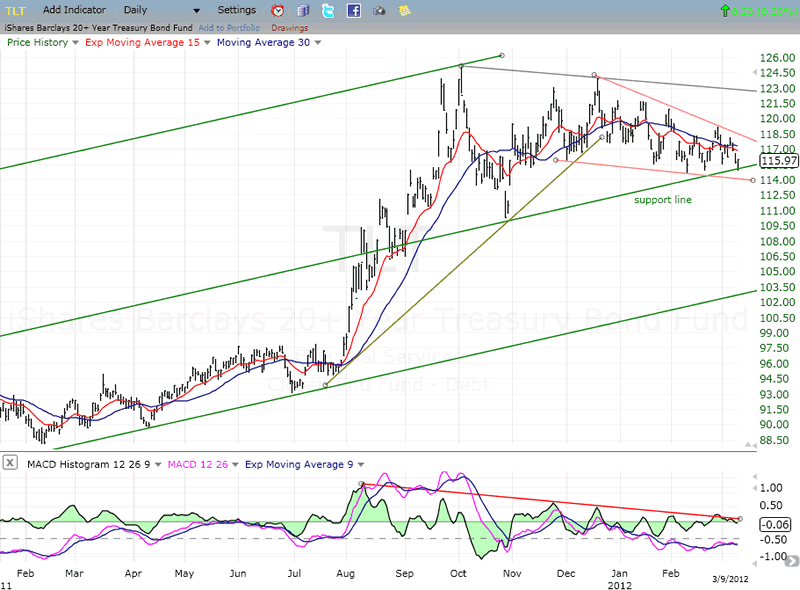
TLT is also telling us that we should not expect a deep correction at this time. Although it is making a wedge pattern which is pointing down - a bullish formation - it does not seem in a big hurry to get out of it.
The indicators are slowly trying to turn up, with the histogram almost ready to break out of the downtrend line, but the MACD is still negative.
If TLT does turn up, it will probably be for a limited move. The wedge is part of a channel which will have to be exited before the index can make more serious headway. On the other hand, prices are currently supported by the mid-channel line of the long-term uptrend. If they break below, it would be a sign that TLT is going into a deeper corrective mode, which would change the whole picture from one of mild consolidation to one of a more extended correction.
Since TLT reached a long-term projection when it traded at 125, it is possible that, instead of making a bullish consolidation pattern, it is actually undergoing an extensive distribution phase which will eventually result in a challenge of its long-term uptrend. That would make sense since the QE phases that were supportive of the bonds are apparently over.
UUP (Dollar ETF) Daily Chart.
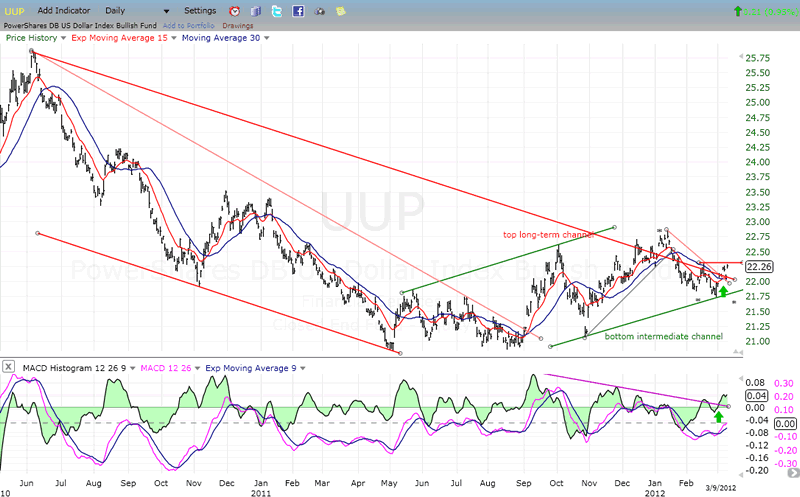
UUP has been in an uptrend ever since it broke out of its base formation. It has dropped to the bottom channel line twice and found support both times. In January, it tried to break out of a long-term downtrend channel, but could not follow through and fell back. Now it is trying again, but it does not seem to have much mojo and may be contained by the former near-term top. There is also a minor cycle bottoming in a few days which should pull it back down temporarily. It has the potential for moving much higher but, at this rate, it will take it months to reach its objective of 25.
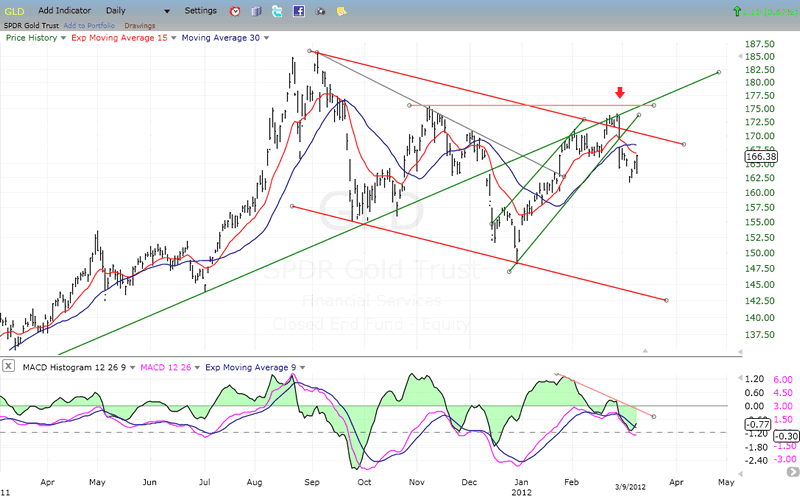
GLD (ETF for gold)
After reaching its 185 projection, GLD broke below a long-trend (log scale) trend line, back-tested it twice, and was pushed back both times. The intermediate correction has created a downward channel which was tested on the second attempt at getting back above the long-term trend line.
Since then, GLD has started a small downtrend which has a projection to about 160, after which it may try, once again to resume its long-term advance. There is some severe overhead resistance that will have to be overcome before it can do that, and it may first require more basing action.
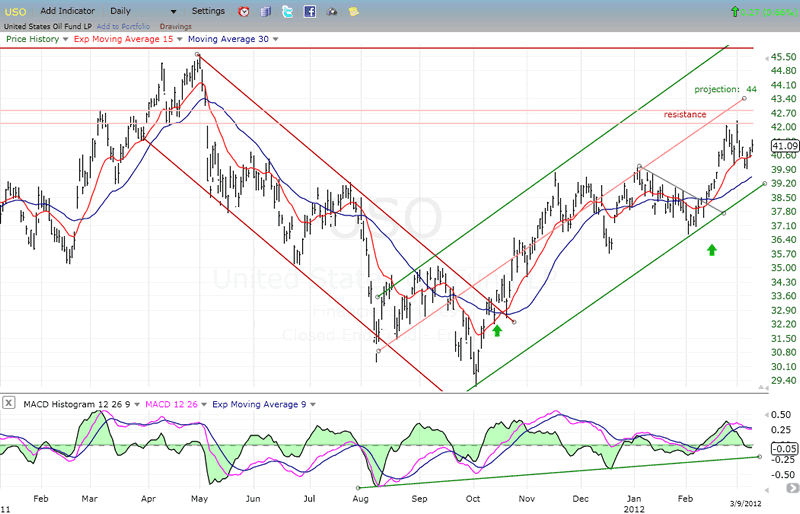
OIL - USO (United States Oil Fund)
USO met with resistance where expected and it has started a near-term consolidation. It has a short-term projection to 44 which it may attempt to reach after it finishes building a small base between 39 and 42.
As long as it remains above its lower trend line, that projection is achievable. USO could, at the same time, also fill a gap created when it suddenly reversed after reaching its 46 target.
Summary
In spite of the strength being displayed by the rebound from the 1340 level last week, the SPX looks as if it may have started a consolidation pattern which is incomplete. While it could make a marginal new high, it is more likely to pull back into a sideways correction than to extend its advance right away. Still, that show of strength is a sign that it may not be ready for a significant correction until it has seen higher prices.
The overall market is mixed. Several indices are lagging, but the financials are strong, while the VIX has fallen back to a level near the low of its downtrend.
FREE TRIAL SUBSCRIPTON
If precision in market timing for all time frames is something which is important to you, you should consider a trial subscription to my service. It is free, and you will have four weeks to evaluate its worth.
For a FREE 4-week trial. Send an email to: ajg@cybertrails.com
For further subscription options, payment plans, and for important general information, I encourage you to visit my website at www.marketurningpoints.com. It contains summaries of my background, my investment and trading strategies and my unique method of intra-day communication with Market Turning Points subscribers.
By Andre Gratian
MarketTurningPoints.com
A market advisory service should be evaluated on the basis of its forecasting accuracy and cost. At $25.00 per month, this service is probably the best all-around value. Two areas of analysis that are unmatched anywhere else -- cycles (from 2.5-wk to 18-years and longer) and accurate, coordinated Point & Figure and Fibonacci projections -- are combined with other methodologies to bring you weekly reports and frequent daily updates.
“By the Law of Periodical Repetition, everything which has happened once must happen again, and again, and again -- and not capriciously, but at regular periods, and each thing in its own period, not another’s, and each obeying its own law … The same Nature which delights in periodical repetition in the sky is the Nature which orders the affairs of the earth. Let us not underrate the value of that hint.” -- Mark Twain
You may also want to visit the Market Turning Points website to familiarize yourself with my philosophy and strategy.www.marketurningpoints.com
Disclaimer - The above comments about the financial markets are based purely on what I consider to be sound technical analysis principles uncompromised by fundamental considerations. They represent my own opinion and are not meant to be construed as trading or investment advice, but are offered as an analytical point of view which might be of interest to those who follow stock market cycles and technical analysis.
Andre Gratian Archive |
© 2005-2022 http://www.MarketOracle.co.uk - The Market Oracle is a FREE Daily Financial Markets Analysis & Forecasting online publication.