


Apple, How Market Booms Turn to Busts, Trading From New Paradigm to Despair
News_Letter / Tech Stocks Jan 09, 2013 - 09:38 PM GMTBy: NewsLetter
 The Market Oracle Newsletter
November 24th , 2012 Issue #23 Vol. 6
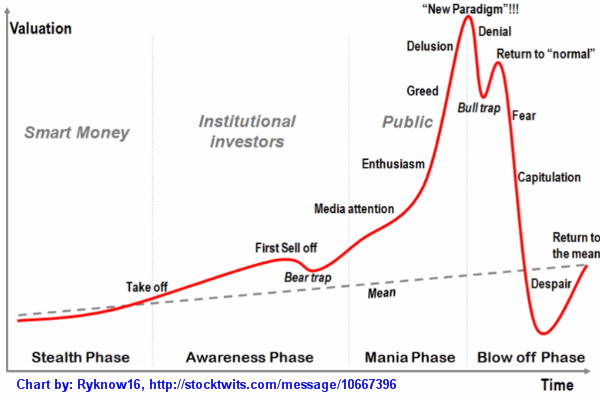
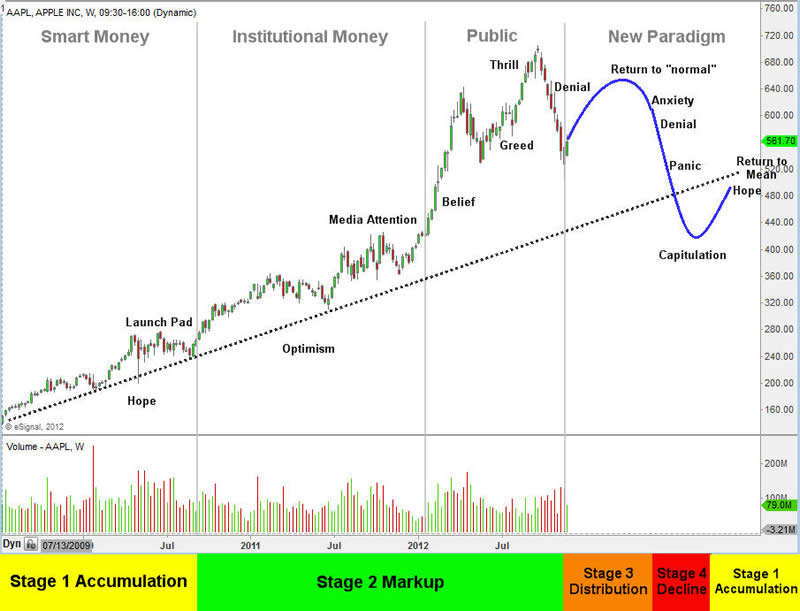
Apple, How Market Booms Turn to Busts, Trading From New Paradigm to DespairDear Reader Chris Vermeulen writes: I know most Apple enthusiasts will be rolling their eyes with my analysis and that's fine because the rest of us need people to buy our shares as we unload long positions or sell Apple short. All joking aside, the charts below clearly show some very interesting information you cannot afford to overlook. At minimum, take a quick glance at the charts which tell the full story on their own... The Four Stages of AAPL & RIMMMarkets are cyclical in nature. There is a constant process of expansion and contraction, rally and decline that continues as the market determines the theoretical fair value of a security. The sum of these moves forms an unquestionable cyclical pattern consistent within all time frames. During a cycle a stock enters different phases of support, from irrational exuberance typically found before its peak, to periods of widespread discontent where its price is continually punished. However there are never distinctly good or bad stocks. Every "good" stock will eventually become a bad one and vice versa. There are however good trades; trades that reward an investor who has correctly anticipated a move and positioned himself accordingly. It is important to note that this works with commodities like gold and silver which are trading at a VERY interesting point in their life cycle. Looking at various time frames in GLD and SLV you can see this. Classic economic theory dissects the economic cycle into four distinct stages: expansion, trough, decline and recovery. A stock is no different, and proceeds through the following cycle:
While these stages are historically defined over long time periods they actually exists in all time frames, allowing traders to take advantage of a cycle regardless of their trading time frame. Fortunately this phenomenon, known as a "fractal", exists within all security markets. A fractal is simply a rough geometric shape that can be subdivided into smaller parts that have the same properties; a smaller version of the whole. This is important to understand because through technical analysis as we are often analyzing multiple time frames. In the short term, the four stage model may repeat itself many times. The combination of these short term cycles form a medium term cycle, and the combination of multiple medium term cycles form a long term cycle. Recognition of these cycles is paramount in trading success. The Four Stages Profile:This signature profile happens over and over again in the market and all the great leaders eventually become laggards.
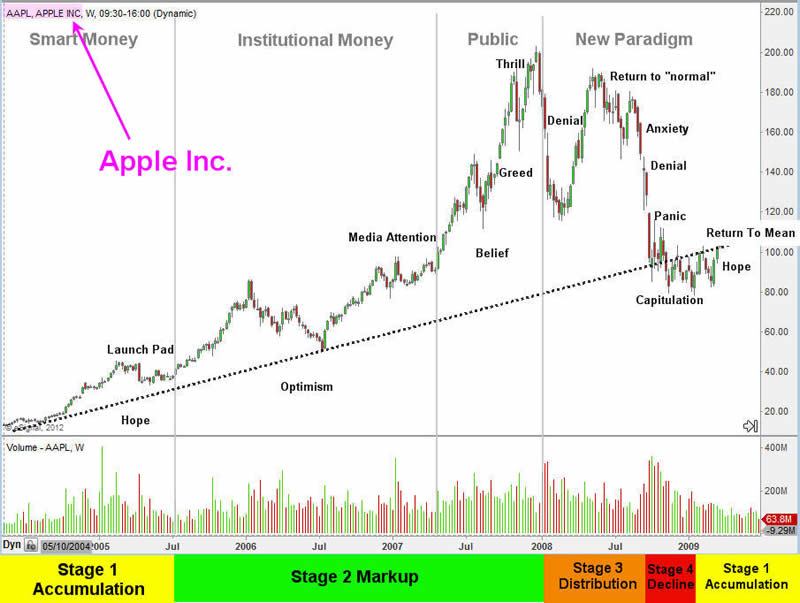
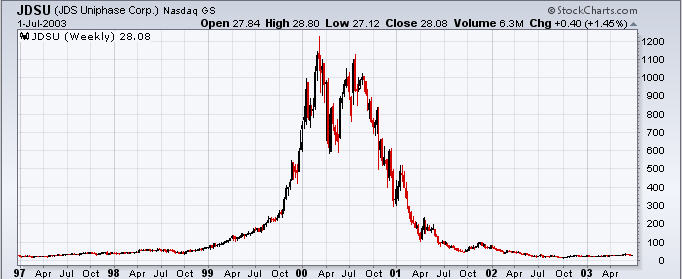
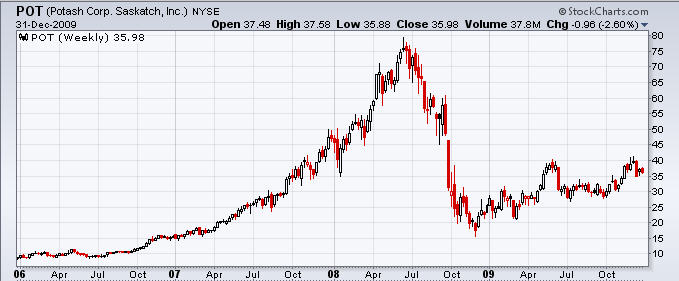
REAL LIFE PROFILES:
Variety in TradingInvestment securities (stocks, ETF's, options, futures) can be described as being similar to different types of athletes, each with their own unique style and personality. Some can be characterized as sprinters, participating in quick bouts of movement but tiring quickly. Others could said to be more similar to a marathoner, enduring prolonged courses in one direction without pause or interruption. When I look to make a trade I look for sprinters as historically I have had the most success with them. Other investors like pension and mutual funds are more interested in the long term marathoner that provides steady performance. There is no one way to trade; each method can be equally profitable or unprofitable. It ultimately comes down to what style works best for you, and the only way that can be determined is through trial and error. Different phases, different strategiesAs noted above, the market alternates between periods of trending activity and periods of consolidation. In a trend (stages 2 and 4) there will be an expansion of the price range in one direction. An uptrend will have a series of higher highs and higher lows (stage 2), while a down trend will produce lower highs and lower lows (stage 4). In a consolidation there will be a contraction of price range prior to a reversal in trend. This neutral stage is avoided by trend traders. A stock in stage 1 or 3 is typically correcting itself after having experience a prolonged move in one direction. These corrections are found after periods of extreme movements that often conclude with emotional and undisciplined trading at peaks and troughs. Trading these two stages is quite different than 2 and 4, and this book will teach you how to manage your risk and trade these stages responsibly. A short term consolidation within a primary trend is one area where we want to study the price action of a security for clues as to whether there will be a resumption in the trend, continued consolidation, or reversal. Sometimes however it is difficult to identify any order or consistency on any given time frame. If you are a trend trader these periods should be avoided. Trading has enough inherent challenges already and at all times a successful trader will only be searching out those trades that have a high probability of being profitable. Trading is all about finding an edge or an advantage and exploiting it for maximum profit. If there is no such edge than there is no reason to be involved. I will say this now and again many other times: Sometimes the best trade is no trade! Naturally, regardless of the stage a stock is in or your conviction of its direction, risk of financial loss is always inherent in trading and this is critical to always keep in mind. The most successful traders are not immune to this and they too will have unprofitable trades. The key is to minimize those loses by only trading those stocks that have the highest probability of being profitable. This is what separates the profitable and professional traders from those that lose money. Emotions and Lifecycle AnalysisHistory has an uncanny ability to repeat itself. Whether it's the rise and fall of an empire or the rise and fall of a stock, there are clear cycles that are prevalent throughout history. People may change, but human nature, and our ability to act, react and overreact is simply an innate part of our being. This predictability is what forms the basis of technical analysis and provides a trader with an edge with which to trade upon. When we are analyzing cycles we really are analyzing emotions, trying to gain insight as to how market participants are behaving. Upon conducting such analysis it can at times seem that markets are be behaving "irrationally" and out of order. Undisciplined traders often fall victim to their emotions and lose control of their objectivity. As people behave irrationally, so too does the market, and unfortunately these conditions can persist for long period of times. John Maynard Keynes is often quoted for suggesting that "The markets can remain irrational longer than you can stay solvent." This is a harsh reality and puts great emphasis on the importance of discipline, risk management, and a keen eye for price action. Emotions are what separate the successful traders from those that lose money. They can be regarded as a relentless opponent, often showing up without warnings and striking you at inopportune times. The successful trader is able to recognize their presence and maintain objectivity, constantly assessing their own strengths and weaknesses. There will ultimately be times where you can't control your emotions; however you can always control how you respond to them. Any time you recognize that your emotions are influencing your outlook you are already one step ahead of the average market participant. It is at this point that you step back, refocus your perceptions, examine the price action, and then take the appropriate action. An understanding of herd or mob mentality is important in trading and can provide you with an edge over the average participant who doesn't contemplate what is happening around them. In a mob or riot, we never know what the feelings and motivations are of all the individual participants. There are however certain emotions that seem to appear at distinct times and a certain predictability in their development. A stock's price action is no different. While we never know the underlying feeling and motivations of all participants, there are distinct emotions that are shared by the herd at various stages of a stock's life. An understanding of these emotions and their implications on the price action of a stock is an advantage that the profitable trader maintains. The Stock Market Lifecycle could be explained in much more detail, but this report gives you the foundation of stock / index trading cycles. I will be covering this topic in a future video with much more detail. The Apple Money Tree Is Losing Its Leaves...
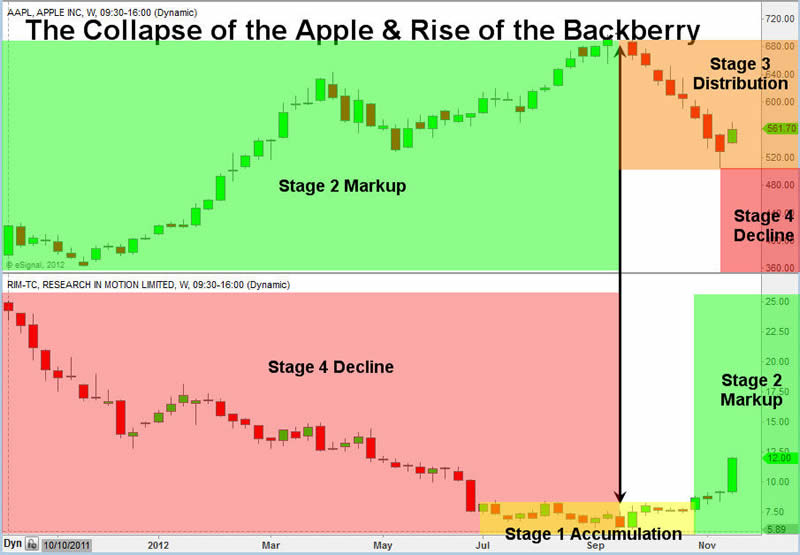
The Fruit War - Apples Top While Berries BottomIt is very interesting that AAPL shares topped the same week rim shares bottomed. Could the BB10 be the turnaround for Research in Motion? Either way the market is somewhat predictable as traders and investors buy the rumor that BB10 will be good, and they sell the news once it arrives no matter the outcome good or bad. Jan 30th is when it's unveiled so we could see RIM shares continue to claw its way out of the grave.
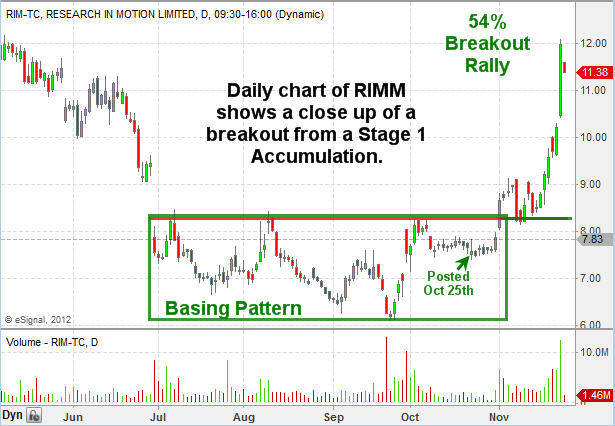
RIM - Daily Chart Look of Price Pattern
Conclusion:Knowing this information is crucial to survival as this cycle happens on all time frames (1 minute chart all the way up to yearly charts). Harnessing this information for trade selection and timing greatly reduces the amount of trades you take, while focusing only on new leaders which have massive upside potential. You can see some of my trade ideas which are in Stage 1 Accumulation mode getting ready for takeoff here: http://stockcharts.com/public/1992897 Judging from the recent price action in the broad market (SP500, NASDAQ, DOW, IWM) along with AAPL shares which have a large impact on index price direction. I feel the market is setting up for a strong Santa Clause rally in the coming week. 2013 looks like it will be a VERY exciting year for trading and investing as several sectors, stocks, and foreign country indexes are in Stage 1 Basing patterns about to start a new bull market. These major plays will become part of my trading alert service at www.TheGoldAndOilGuy.com from this point forward. By Chris Vermeulen Please visit my website for more information. http://www.TheGoldAndOilGuy.com Chris Vermeulen is Founder of the popular trading site TheGoldAndOilGuy.com. There he shares his highly successful, low-risk trading method. For 7 years Chris has been a leader in teaching others to skillfully trade in gold, oil, and silver in both bull and bear markets. Subscribers to his service depend on Chris' uniquely consistent investment opportunities that carry exceptionally low risk and high return. This article is intended solely for information purposes. The opinions are those of the author only. Please conduct further research and consult your financial advisor before making any investment/trading decision. No responsibility can be accepted for losses that may result as a consequence of trading on the basis of this analysis.
You're receiving this Email because you've registered with our website. How to Subscribe Click here to register and get our FREE Newsletter To access the Newsletter archive this link Forward a Message to Someone [FORWARD] To update your preferences [PREFERENCES] How to Unsubscribe - [UNSUBSCRIBE]
The Market Oracle is a FREE Financial Markets Forecasting & Analysis Newsletter and online publication. |
|||||||||||||
© 2005-2022 http://www.MarketOracle.co.uk - The Market Oracle is a FREE Daily Financial Markets Analysis & Forecasting online publication.