


U.S. Economy Death Cross - Trouble Coming to Paradise
Stock-Markets / Stocks Bear Market Feb 09, 2013 - 01:29 PM GMTBy: Gordon_T_Long

 The Macro Indicators are signaling there is potential trouble coming to paradise.
Goldman Sachs points out in a recent study that there is a remarkably strong correlation which has emerged as a result of global central bank policy initiatives. The steely eyed Tyler Durden at Zero Hedge points out:
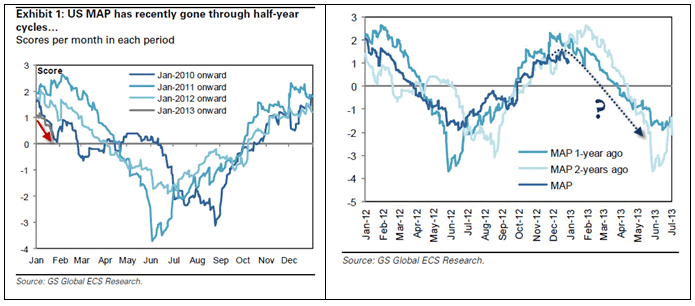
We have noted the odd cyclicality in macro data (and its leading effect on the market) and it seems Goldman Sachs has also noticed that something is different this time. For 15 years, the seasonal patterns in Goldman's macro index have been mild to totally negligible; but since 2009, something changed.
As the chart below indicates, it really is different this time as the macro cycle has become extremely short and consistent (drop in H1, rise in H2) - and is evident not just top-down but bottom-up in payrolls and ISM for instance. Goldman expounds pages of statistical jiggery-pokery to show what we suspected - that this is not weather or seasonality effects, and is not just US (UK and Europe see same pattern of six month cycles); but appears driven by central-bank policy actions (which have been more concentrated in Q4/Q1). 2013 is playing out exactly as the last three years has - with a downdraft that is set to continue for the next few months - though they note that stability in oil prices this time (and recent expansion of easing efforts - Fed and BoJ) may shift the pattern. For now, it appears the macro cycle is becoming shorter and warrants concern as they are unable to find anything but 'reality' as a driver of this odd cyclical pattern as the real economy fades rapidly after each and every infusion of promises from the Central Banks.
US Macro data is following the same downward path as we have seen for the last three years...
.. each year Q4/Q1 is dominated by fiscal or monetary policy actions to recover from the exposed reality of the underlying economy...
Will this time be any different? Well, we noted the lead-lag relationship here before, and as stocks test new highs with macro data plumbing new depths, we can only imagine which better reflects reality for now.
As Goldman concludes:
Given that we are now in the part of the year that has typically presaged macro weakness, we will be paying close attention to developments in fundamental factors: policy, financial conditions, oil prices, and shocks from the rest of the world and the Euro area.
Put simply, each year central banks lift their foot modestly to see just what is going on in the real world, and each year the reality is not good - which then pushes them back into action; the question is (with BOJ not going open-ended until 2014, OMT off the table for Spain for now, and Fed QE4EVA 90% priced in) when will the central banks come back and with what...
Charts: Goldman Sachs
Separately, we have noticed that each of the REGIONAL Economic Surprise Indices are also ALL following the same pattern GLOBALLY.
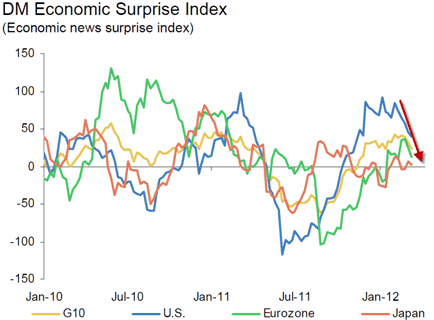
The above chart also suggests that economic "reality" is once again not meeting the analysts' growth and market expectations. This has become an annual event.
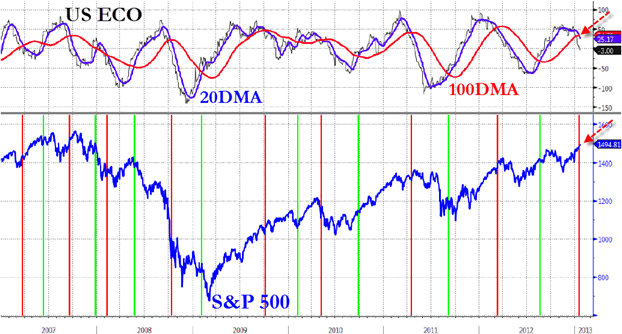
Death Cross
The ECO pattern is clear. A 'death cross' of the 100 DMA through the 200 DMA is a strong confirming signal that a sustained change in perceptions is now underway.
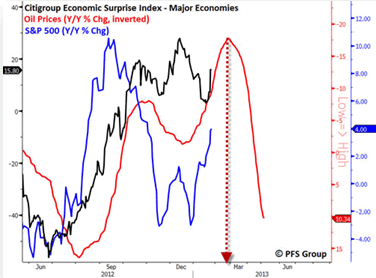
As JP Morgan's Tom Lee points out, the US Citigroup Economic Surprise Index (below) has moved below zero. On the past 7 occasions when this happened the near-term equity upside was capped. The average maximum upside of 1% and average drawdown of 8% seen over the following 3 months demonstrate the asymmetric risk-reward in our view.
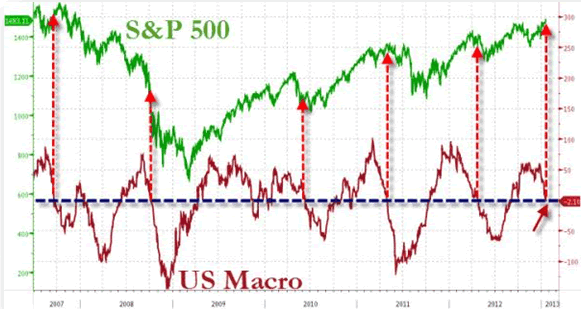
Chris Puplava at Financial Sense Network has also noted yet another correlation:
.... as you can see in the close up below, the rise in oil prices six months ago suggests we see a peak in economic positive surprises and the stock market in late February to early March. Given we likely have a peak in economic activity and the stock market in 4-6 weeks based on prior oil prices, even if interest rates breakout their run is likely to be short-lived and a plunge in interest rates and rise in real interest rates (if nominal rates fall faster than inflation) may be the catalyst that sees gold stabilize and begin to advance.
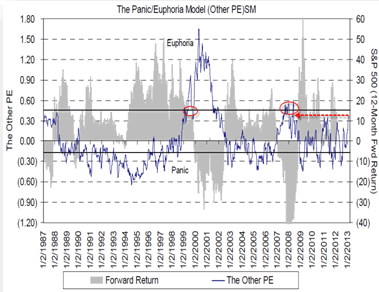
We have an endless array of charts showing extreme market levels but three of note are:
-
Citi's Panic/Euphoria gauge for US stocks (right) has only been more euphoric on two occasions - Q4 2000 & 2008,
-
Goldman's S&P 500 Positioning which has only been this extremely long-biased on two occasions - Q4 2008 & Q2 2011; and
-
Barclays' Credit-Equity divergence which has only been this over-bought stocks on two occasions - Q4 2008 & Q2 2012.
Earnings Decidely Negative
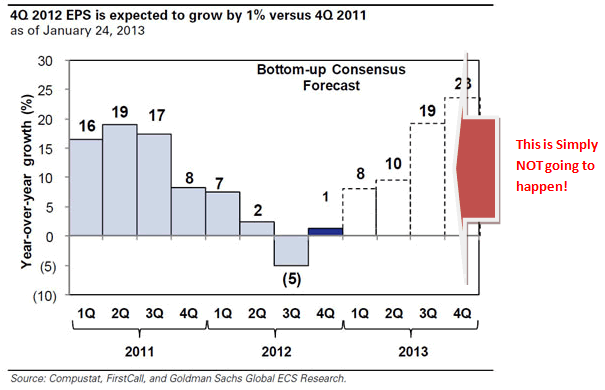
Switching gears we need to consider that fact that so far Q4 2013 earnings have been far worse than most (so far) suspect:
There has been some confusion about the quality of the ongoing Q4 earnings season, which has seen some 47% of the S&P 500 companies report to date (and with 53% still left things can certainly change). The confusion apparently is that this has been a "good" earning season so far. Nothing could be further from the truth, and as Goldman shows in its midterm Q4 earnings report, the reality, not spin, is that earnings are tracking at $24.03, or some 6% below the consensus estimate at the start of earnings season of $25.51. This revised number, which could well drop even more from here, means that Q4 earnings will post a minuscule 1% growth in EPS year over year compared to Q4 of 2011 when Europe was imploding, and when the world's central banks had to arrange a global bailout to prevent yet another Armageddon.
Here are the facts:
- Using a mix of realized and consensus earnings, 4Q EPS is tracking 6% below the consensus estimate at the start of reporting season, $24.03 vs. $25.51
- Positive earnings surprises are tracking below average this quarter (34% vs. 42%). The percentage of firms missing earnings estimates by one standard deviation or more is above the 40 quarter average (18% vs. 14%).
- 36% of firms beat consensus sales expectations by more than one standard deviation, below the 10-year historical average of 38%. In addition, 19% of firms have missed sales estimates by that magnitude (versus 18% historically).
In summary, the S&P 500 is expected to earn some $98 for all of 2012, which means that as of this moment, the market is trading at a quite rich 15+ multiple (although what multiples mean under central planning nobody knows yet). So how does the S&P500 go from 98 in earnings in 2012, to the consensus 111 in S&P500 EPS in 2013? A magic escalator apparently.
Bottom Line - S&P 500
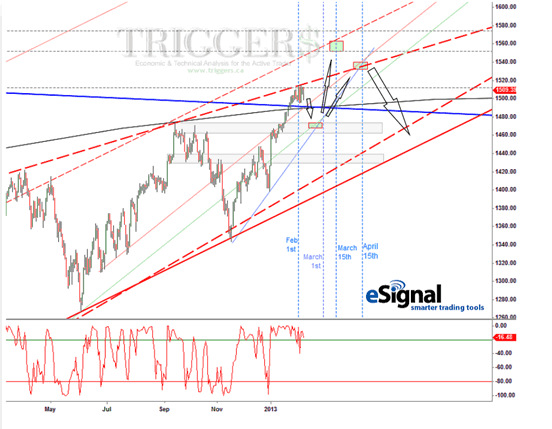
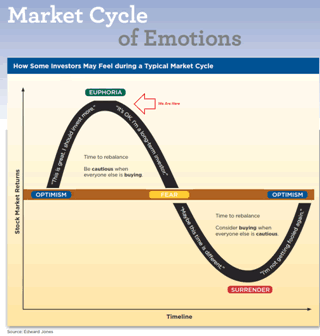
We are now in the early stages of shifting from an extreme condition of complacency. This has been coupled with elevated levels of a potential economic or geo-political shock to the market and OVER OPTIMISTIC INVESTOR SENTIMENT.
Conditions are suggesting we have a RISK-OFF environment looming ahead of us before the Ides of March..
Download your FREE TRIAL copy of the latest TRIGGER$ Checkout the GordonTLong.com YouTube Channel for the latest Macro Analytics from expert Guests
Gordon T Long Publisher & Editor general@GordonTLong.com
Gordon T Long is not a registered advisor and does not give investment advice. His comments are an expression of opinion only and should not be construed in any manner whatsoever as recommendations to buy or sell a stock, option, future, bond, commodity or any other financial instrument at any time. While he believes his statements to be true, they always depend on the reliability of his own credible sources. Of course, he recommends that you consult with a qualified investment advisor, one licensed by appropriate regulatory agencies in your legal jurisdiction, before making any investment decisions, and barring that you are encouraged to confirm the facts on your own before making important investment commitments. © Copyright 2013 Gordon T Long. The information herein was obtained from sources which Mr. Long believes reliable, but he does not guarantee its accuracy. None of the information, advertisements, website links, or any opinions expressed constitutes a solicitation of the purchase or sale of any securities or commodities. Please note that Mr. Long may already have invested or may from time to time invest in securities that are recommended or otherwise covered on this website. Mr. Long does not intend to disclose the extent of any current holdings or future transactions with respect to any particular security. You should consider this possibility before investing in any security based upon statements and information contained in any report, post, comment or suggestions you receive from him.
Gordon T Long Archive |
© 2005-2022 http://www.MarketOracle.co.uk - The Market Oracle is a FREE Daily Financial Markets Analysis & Forecasting online publication.