Gold - Investor Safety Blanket or Quilting Essential?
Commodities / Gold and Silver 2013 Feb 14, 2013 - 09:06 AM GMTBy: Adrian_Ash
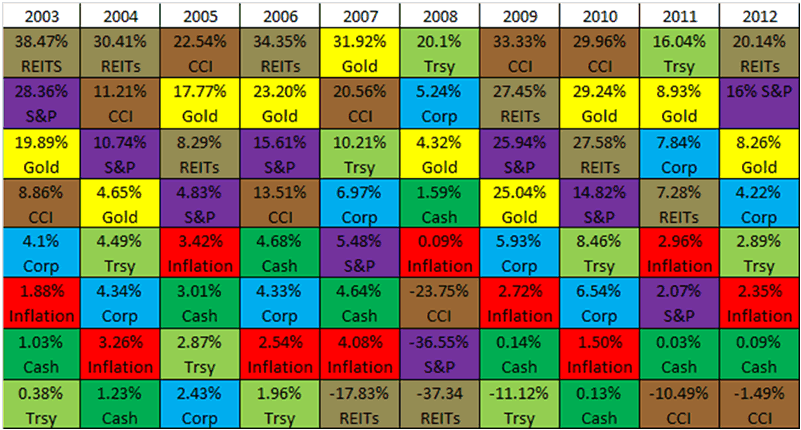
 The patchwork quilt of diversification looks awful smart. It's more than pretty with gold in it, too...
Investment experts keep telling us two things.
One, you must diversify your savings. Nothing works for ever. Two, your annual returns are set to be miserable, because there's no return to the out-sized gains of the 1980s and '90s. The last 10 years prove that.
Now, we don't doubt Point 1. Not even people buying gold in 2001 could in fact see the future (though we might tell you different tomorrow). That second claim needs a closer look, however.
US Assets, US Dollars: Total Annual Returns (before expenses & tax)

Source: BullionVault via CRB, LBMA, NAREIT, NYU Stern, St.Louis Fed
REITS = FTSE Real Estate Investment Trusts S&P = S&P 500 equity index CCI = CRB Continuous Commodity Index Corp = Barclays Aggregate US Bond Index Trsy = 10-year US Treasury bonds Cash = 3-month Treasury bills
The idea is simple enough. Our patchwork quilt above looks a lot like the more famous Callan Periodic Table (well, famous to finance nerds and investing professionals). It compares the annual returns on a selection of assets. In the case of the Callan Table, those assets are mostly stock-market indices, split into emerging markets vs. Europe vs. a range of thinly sliced US segments (Russell 2000 Growth anybody?).
But while that's useful, perhaps, for equity-fund investing, there are lots of other things which both private savers and the professional investors supposed to be working for them also buy. What about commodities, real estate, gold, cash or T-bonds?
Now, as you can, and just like the people Callan say - as well as more finely-sliced examples, such as Frank Holmes at US Funds ranking the different tradable commodities - "The Table highlights the uncertainty inherent in all capital markets.
"Rankings change every year."
There are broad patterns over time, however. No asset class makes #1 for more than two years running, for instance, not in the 35 years of data we've crunched. (More on the full table next week.) Most recently, and with the calls for a gold bear market in 2013 growing louder each day, it's also notable that:
-
Gold has been the #1 asset only once. It placed in the top 3 performers in eight out of the last 10 years;
-
Real Estate Investment Trusts, if averaged, were the #1 asset class in 3 of the last 10 years. They made the top 3 seven times, but slumped to worst position twice;
-
Cash has now lagged inflation 4 years running for US savers.
The upshot? Going forwards, no idea. But looking at that "poor returns ahead" warning, it only gains credence from the past decade if you ignore gold. Which is of course what most packaged-finance promoters do. They might well ignore real estate and commodities as well.
Investing money evenly split however between US equities, investment-grade corporate bonds, Treasuries, cash, gold, commodities and real estate would have returned 6.5% per year on average, over and above inflation, since the start of 2003. Even if you'd avoided miserable gold all through the 1980s and '90s, you would still have made only 5.4% per year during those go-go decades.
Including an even allocation to gold investment, in fact, the last decade's returns stand very nearly two full percentage points better than the average real return since 1977 (again, pre-tax but post-inflation, and excluding trading costs). At 4.6% per annum, that 35-year average also sneaks ahead of the average return if you had avoided gold too, at 4.4%.
"Gold is the equivalent of a financial teddy bear," as one UK fund manager never tires of saying. And saying - and again. People cling to it, in short, for emotional support instead of rational reasons. Yet the patchwork quilt of a diversified portfolio is no mere safety blanket. And it's warmer still if you add gold to your color scheme.
By Adrian Ash
BullionVault.com
Gold price chart, no delay | Buy gold online at live prices
Formerly City correspondent for The Daily Reckoning in London and a regular contributor to MoneyWeek magazine, Adrian Ash is the editor of Gold News and head of research at www.BullionVault.com , giving you direct access to investment gold, vaulted in Zurich , on $3 spreads and 0.8% dealing fees.
(c) BullionVault 2013
Please Note: This article is to inform your thinking, not lead it. Only you can decide the best place for your money, and any decision you make will put your money at risk. Information or data included here may have already been overtaken by events – and must be verified elsewhere – should you choose to act on it.
Adrian Ash Archive |
© 2005-2022 http://www.MarketOracle.co.uk - The Market Oracle is a FREE Daily Financial Markets Analysis & Forecasting online publication.


