


Uranium Stocks Outlook Looking Brighter
Commodities / Uranium Apr 10, 2008 - 10:52 PM GMTBy: Merv_Burak
 Every day looks brighter and brighter. With another up day in the uranium stocks the trend is changing although we still have a ways to go to be all gung-ho bullish. The Merv's Daily Uranium Index closed higher by 0.062 points or 2.21%. There were 26 winners, 20 losers and 4 unchanged. Of the five largest stocks Cameco gained 4.8%, Denison gained 7.1%, First Uranium lost 0.9%, Paladin lost 1.1% and Uranium One lost 0.2%. Although the losses were small we still have three of the five largest stocks moving lower.
The best performer of the day was UEX with a gain of 19.7% while the worst performer was Khan with a loss of 5.5%. This low % loss as the largest loss of all component stocks is encouraging. It's the second day that the losses were of a minor nature.
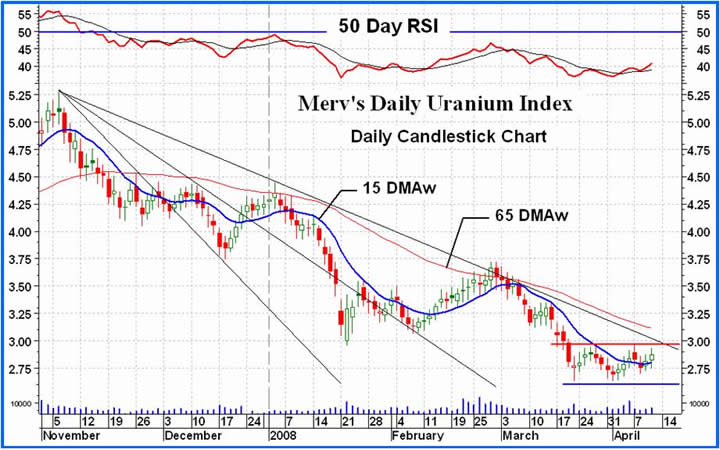
The Index is still below its negative intermediate term moving average line. It's getting very close towards the Index breaking above that “box”, the third FAN trend line AND the intermediate term moving average line. All three are presently very close together. I wonder what the action will look like once all of these resistance points get breached? The intermediate term momentum indicator continues to move higher towards its neutral line but is still in its negative zone. It is above its positive trigger line confirming the upward trend. The volume indicator is also above its intermediate term trigger line and the trigger is sloping upwards. The intermediate term is slowly firming up and the rating is being upgraded, but just slightly, to – NEUTRAL .
Things are continuing to look brighter and brighter on the short term. Although we are still inside that “box” the Index continues higher above its positive sloping short term moving average line. The short term momentum indicator is swiftly climbing towards its neutral line, above its positive trigger line, but is still inside its negative zone. It should break above in another day or two of upside action. The volume indicator is above its short term positive trigger line. Very important, for the first time in almost five weeks the very short term moving average line has now moved above the short term line for a confirmation of a bullish short term trend. All in all the short term rating remains BULLISH.
A quick note about the very short term (or immediate term) rating. The Index is moving higher above its very short term positive sloping moving average line. However, the aggressive Stochastic Oscillator remains basically unchanged from yesterday. It is slightly below its neutral line in the negative zone and still below its negatively sloping trigger line. When I put these together I still get only a + NEUTRAL rating, not quite a fully bullish one. One may wonder what's the deal here. Well, the SO takes note of the closing price and its relationship with the day's overall trading range. The closer the close is to one or other extreme the more the SO moves. The closer it closes to the middle of its trading range the less it moves. The past two days the closing price has been closer to the middle of the trading range than to the upper high. T
his has caused the indicator to move more sideways rather than in an upwards direction. In brief, the thinking here is that the stronger the trend the closer it will close to its daily high (or low). What the SO is telling us is that so far, although the Index may be moving higher it still does not have any great strength behind the move. This needs to improve if we expect to have longevity to the move. As an aside, a very short term RSI would give us an indicator in its positive zone above its positive trigger line and therefore a bullish rating. For this immediate term trend I prefer the aggressive Stochastic Oscillator because of its implication towards the strength of the immediate move.
By Merv Burak, CMT
Hudson Aero/Systems Inc.
Technical Information Group
for Technically Uranium with Merv
Web: http://techuranium.blogspot.com/
e-mail: merv@themarkettraders.com
During the day Merv practices his engineering profession as a Consulting Aerospace Engineer. Once the sun goes down and night descends upon the earth Merv dons his other hat as a Chartered Market Technician ( CMT ) and tries to decipher what's going on in the securities markets. As an underground surveyor in the gold mines of Canada 's Northwest Territories in his youth, Merv has a soft spot for the gold industry and has developed several Gold Indices reflecting different aspects of the industry. As a basically lazy individual Merv's driving focus is to KEEP IT SIMPLE .
This Blog is - A periodic review of the daily or weekly market action in uranium stocks. The review is strictly from the technical perspective. Merv is a pure market technician. Weekly, one will find a table of technical information and ratings of the 50 component stocks of the Merv's Uranium Index as well as a weekly summary of the uranium stock activity. Daily (most days), one will find a daily review of the market action of the Merv's Daily Uranium Index as well as technical analysis of one or more uranium stocks of interest.
Disclaimer - Technical analysis is not perfect. Should you expect perfection this is not the site for you.
Technical analysis IS a very sound technique to assess the daily or weekly trading activities in securities and to assess appropriate timing of investment activities. This blog provides such technical analysis of the trading activity in uranium stocks for your information. Any use made of this information is strictly at the users risk. No guarantees are made for the accuracy or potential for the information provided herein. Use at your own risk. You are strongly advised to check with your broker or investment adviser before activating any investment desisions.
Merv Burak Archive |
© 2005-2022 http://www.MarketOracle.co.uk - The Market Oracle is a FREE Daily Financial Markets Analysis & Forecasting online publication.