


Stock Market Update: Survival of the Unbiased Trader
Stock-Markets / US Stock Markets Apr 28, 2008 - 09:08 AM GMTBy: Dominick
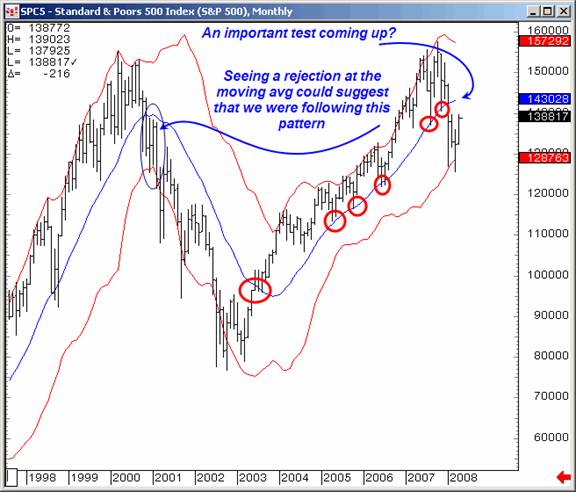
 I'm sure a few heads were turned when I first posted the chart above, which suggests the S&P could rally to 1430 before finally deciding whether this is a bull or bear market. What makes this chart great is it underscores the nature of unbiased trading: no matter what your personal convictions are, or your interpretation of economic data, the market has not decided bull or bear and neither has the unbiased trader.
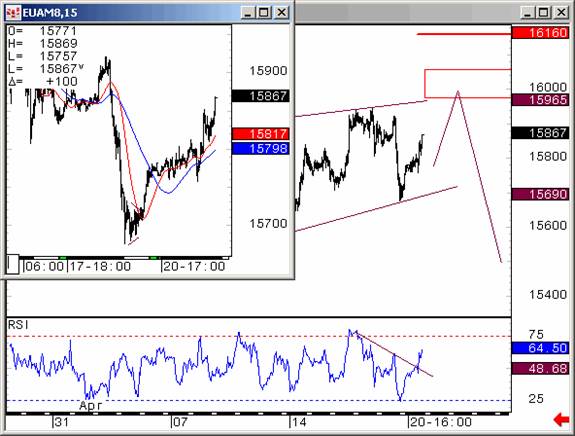
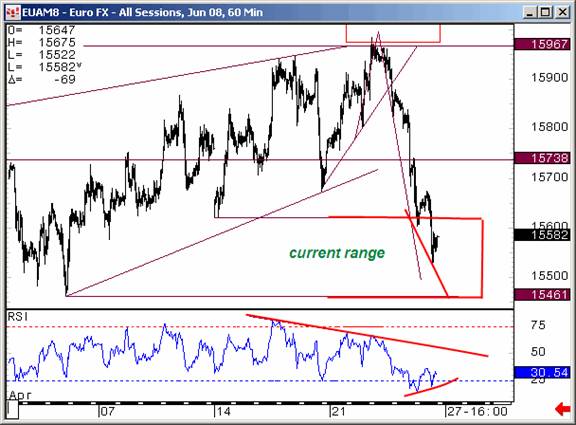
In demonstrating how TTC plans its trades from charts, not bias, last weekend's update showed how news from the G7 actually suggested another high in the euro by forming an ending diagonal pattern, shown above in a chart posted last Monday. For most, however, the news suggested to sell euros, but those who shorted the initial decline had to take a lot of pain as the rally into our expected high unfolded in textbook fashion. By the end of the week, the chart looked like this:
Recent updates have also emphasized our proprietary pivot numbers, which we use to gauge price action and market direction. Several of these are shown in the chart below overlaid on the S&P futures to show the market's recognition of these levels.
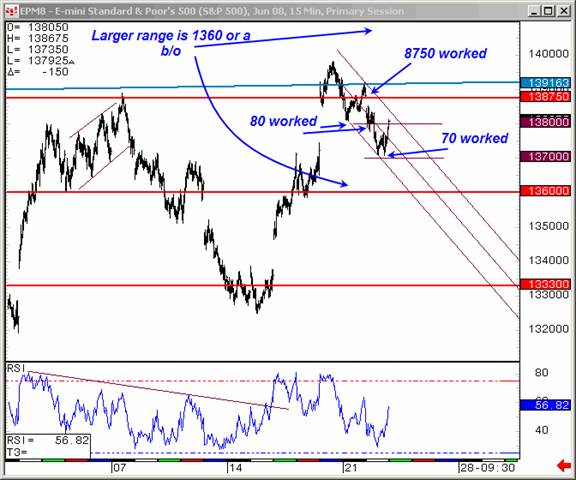
Regular readers will recall that 1360 has worked as a sort of on/off switch for short term bullish or bearish outlooks. With resistance holding ten points above that level, it was easy for us to expect further upside and devise the following chart:
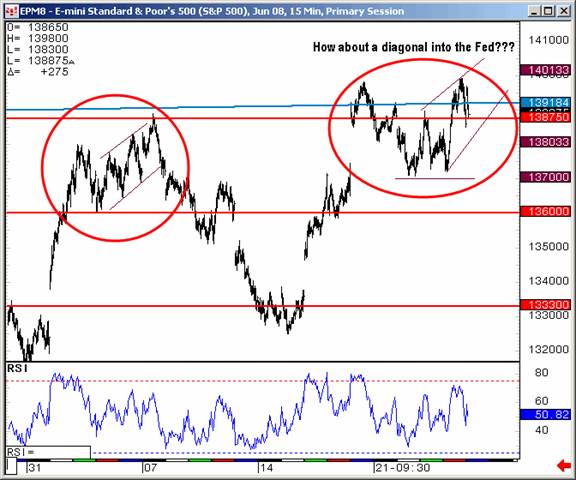
Last week's update mentioned specific patterns reserved for members only, and the S&P chart above shows one of those patterns. Notice the suggestion of a diagonal to close the week leading to the Fed meeting, and the guidelines showing when the pattern would be invalidated. After this chart was posted, the ES did in fact trade down to the low 1380s and then, as you know, rallied to close the week near 1400. Attentive members captured 20 points in a single afternoon on this single trade in this single market.
Do you want to learn how to trade multiple markets in short term time frames with a toolkit of various techniques? Would you like to join a growing community of professional traders and gain access to next week's charts right now? If you feel the resources at TTC could help make you a better trader, don't forget that TTC will be closing its doors to new retail members on May 31,2008 . Institutional traders have become a major part of our membership and we're looking forward to making them our focus.
Are you ready to breakout from bias and trade these volatile markets come what may? Ten to twenty big picture charts are posted every weekend to orient your trading to what the market says, not some bias. But, the opportunity to join the TTC community of traders is slipping away from retail investors. We originally thought we would close the doors to new retail in June or July, but I've decided to move that up closer to May 31, Memorial Day weekend.
TTC is not like other forums, and if you're a retail trader/investor looking to improve your trading, you've never seen anything like our proprietary targets, indicators, real-time chat, and open educational discussions.
But the only way to get in is to join before the lockout starts. If you're really serious about trading learn more about what TTC has to offer and how to join now .
Have a profitable and safe week trading, and remember:
"Unbiased Elliott Wave works!"
By Dominick , a.k.a. Spwaver
www.tradingthecharts.com
This update is provided as general information and is not an investment recommendation. TTC accepts no liability whatsoever for any losses resulting from action taken based on the contents of its charts, commentaries, or price data. Securities and commodities markets involve inherent risk and not all positions are suitable for each individual. Check with your licensed financial advisor or broker prior to taking any action.
Dominick Archive |
© 2005-2022 http://www.MarketOracle.co.uk - The Market Oracle is a FREE Daily Financial Markets Analysis & Forecasting online publication.