


Stock Market 4-6% Pullback in S&P 500 Possible Soon
Stock-Markets / Stock Markets 2014 May 23, 2014 - 12:00 PM GMTBy: Submissions

Brad Gudgeon writes: The stock market appears to be on the verge of a 4-6% pullback. All the cycles, wave analysis, technical analysis, sentiment and pattern analysis I analyze point to a quick downdraft over the coming days into early June.
As of this writing on Thursday, May 22, 2014, the S&P 500 appears to want to make a nominal new high above the old high of 1902. We could make that high on Friday and sell-off easily.
By no means do I believe the bull market is dead, it is just plain tired and needs a pullback so it can launch higher.
There are some concerns going forward, particularly, the 12-year cycle low due in the fall, but for now, a healthy pullback has the earmarks of higher prices ahead once the sell-off is complete.
In this chart of the SPY, I show the possible outcome into about June 2-3. The cycle here is half the 155 trading day low, which normally runs 75-80 TD’s. It is combining with the larger 20 week cycle which last ran 23 weeks and ended in Feb 2014. A truncated 17 weeks would complete a nominal 40 week cycle from the end of August 2014.
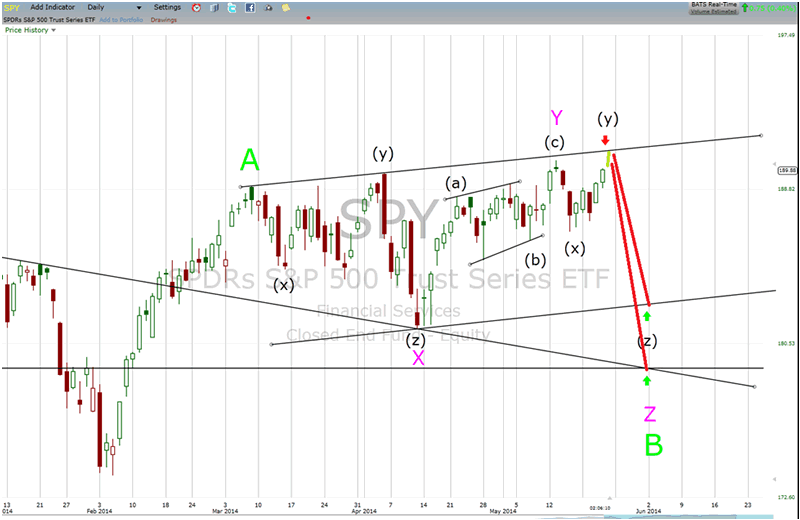
The e-wave notation is ABC, with Wave C yet to come. The last move up looks like an irregular double top on the S&P 500 (SPY) and is labeled wave (y) of Z of B. The two outcomes are noted. If the largest occurs, we should see a dip of about 6%, same as the Jan/Feb drop.
Some of my other cycle lows also join in around June 2-3, mainly the 8/16/32 TD lows. There is also a Delta Projection (based on the tides and moon) into that same date.
Maximum downside projection is in the S&P 500 1790-92 area. The pattern is bullish and once resolved, should make new highs ahead into July.
Good Trading!
Mr. Brad Gudgeon
BluStar Market Timer Investment Philosophy: The stock market is currently in a technical Elliott Wave Bear Market Rally. It has been exhibiting A-B-C type waves instead of the normal 5 Waves since the market topped in 2000. According to “The Original Works of R.N. Elliott”, we are due for a move down to about the S&P 500 442/443 area in the next few years. In my opinion, this is no longer a buy and hold market, but a traders’ market. We mainly swing trade the market with funds and ETF’s, but otherwise trade according to the market’s disposition and to the traders’ discretion. For the year 2014, BluStar Market Timer is rated #1 according to Timer Trac.
http://www.blustarmarkettimer.info
Copyright 2014, BluStar Market Timer. All rights reserved.
Disclaimer: The above information is not intended as investment advice. Market timers can and do make mistakes. The above analysis is believed to be reliable, but we cannot be responsible for losses should they occur as a result of using this information. This article is intended for educational purposes only. Past performance is never a guarantee of future performance.
© 2005-2022 http://www.MarketOracle.co.uk - The Market Oracle is a FREE Daily Financial Markets Analysis & Forecasting online publication.