


Gold Severe Downtrend to Possibly Towards $660
Commodities / Gold & Silver May 04, 2008 - 09:30 AM GMTBy: Merv_Burak

 Up, down, up, down, up but in the end the downs have it. For every $5 to $8 that gold goes up it goes down by $20. That's not the way to new highs. For now it looks like the down side is the direction of least resistance but for how long?
GOLD : LONG TERM
With the confirmation of a long term P&F bear market in progress this is what the long term P&F chart looks like now. The two previous lows were breached earlier at the $900 level and the up trend line was finally breached at the $870 level on Wednesday.
The down side projections, according to this long term P&F chart, are initially to the $840 level (we're just about there) and then to the $660 level. These are from the original breach of the lows but not confirmed until the bear was confirmed. On the bear confirmation we have still another projection, to the $600 level. We'll just have to wait and see how all this pans out.
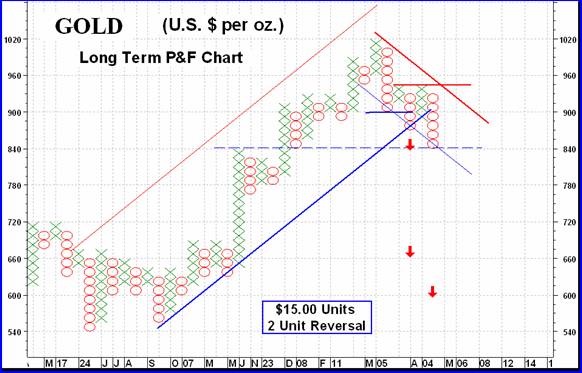
Based upon the P&F chart one might not be surprised if we get a rally around here. The down move had taken gold to its down trend support line (the light blue line) from where earlier rallies took place. There is nothing magic about these down trend support lines (or the up trend resistance lines such as the light red one). Very often they seem to work quite well but I would not risk any capital solely because of these lines. They are a guide and warning lines.
Going to our normal chart and indicators we still get a better looking story. Although gold has dropped below my long term moving average line (a 200 day weighted moving average) the line is still pointing upwards. For those who prefer the simple 200 day moving average line gold is still some $36 above that line. The long term momentum continues to move lower below its negative trigger line but is still above its neutral line in the positive zone. As for the volume indicator, it seemed to have gone back into a lateral path but is still below its now negative sloping trigger line. Putting it all together the indicators do not quite get us into a full bear territory but we are at the – NEUTRAL level, which is just one level above a full bear.
INTERMEDIATE TERM
While the long term is not yet in a confirmed bear mode (by my indicators) the intermediate term just keeps digging itself a deeper hole. Since the all time mid-March high gold has been making new reaction lows. Although it is now at a support from the mid-January low the momentum indicator is performing even worse. It is at a low that it hasn't seen since October of 2006, just before starting its last big bull move. The volume indicator is also moving lower but it is somewhat less negative than the other indicators. Of course, the volume indicator is often a lagging indicator at market tops. One might be expecting a rally from these levels but at this time any rally would not be expected to have any longevity.
Going to our normal chart and indicators gold is below its negative sloping moving average line. The intermediate term momentum indicator is in its negative zone and pointing lower, below its negative trigger line. The volume indicator seems to have stabilized but is below its negative sloping trigger line. All in all, the intermediate term rating remains BEARISH .
SHORT TERM
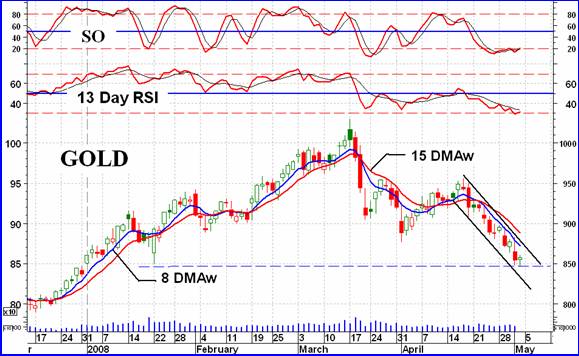
Most speculators are always looking for a positive sign in the market. In the short term chart there are three features that one may grab on to if one was really desperate. The first and most obvious is the support at the $850 level from activity in mid-January. However, such support was very brief and probably has very little influence on present prices. The second feature is the two momentum indicators, the short term RSI and the more aggressive Stochastic Oscillator. They both had crossed into their oversold zones and are now just a hair above their oversold lines, above the oversold zone. This cross back above the oversold line is often an indication of a rally in progress or close to happening. The third possible positive feature is the Friday action. If one puts their mind to it one might see an opposite candle to that of two weeks ago at the very top just before the latest down move. This may indicate an up move ready to come. None of these are very solid and one should wait for better confirmation of a reversal. One should not miss much by waiting a day or two for a confirmation.
Despite the above, looking at the short term indicators, we see the Index still below its short term negative moving average line and still well fixed inside that downward sloping channel. The momentum indicator remains in its negative zone and below a negative trigger line. So, at this point the short term rating remains BEARISH.
SILVER
With a 2.3% decline this past week versus a 3.4% decline for gold, silver continues to out perform gold as we see in the Table. It has a superior Relative Strength ( RS ) versus gold for all three time periods. What this means is that silver either hasn't dropped as far as gold or it has advanced higher than gold, for the respective time period. Other than that the chart of silver is very much like the chart of gold. However, with the slightly better Relative Strength the momentum indicators are not quite as negative as the gold momentum indicators are. This doesn't say much but is somewhat of a plus as far as silver is concerned. In the end, the ratings are the same as for gold
Precious Metals Stocks
In my unbiased view the best indications as to what is happening to the precious metals stocks are the various Merv's Indices. The Merv's Gold & Silver 160 Index tells us what the universe is doing, the Merv's Gold & Silver 100 tells us what the largest 100 stocks traded in the North American markets are doing, the three sector Indices tell us what the highest quality, the second highest quality and the gambling stocks are doing. The two Silver Indices tells us what the quality and speculative silver stocks are doing.
And they are all doing badly.
It was the turn of the quality stocks to take the biggest hit this week while the gambling stocks took a rest and even moved slightly higher. This is noted by the weekly % change in the Indices and the fact that only 4 of the 30 quality stocks advanced while a full 14 of the 30 gambling stocks advanced. Overall, in the universe there were twice as many decliners as advancers. There were 51 stocks on the advance (32%) while there were 104 stocks on the decline (65%).
One of the features I provide my subscribers is to highlight those stocks whose primary intermediate term ratings had just changed from bullish to bearish or from bearish to bullish. An indication as to how bearish the present market is can be seen in the percentage of stocks, for the intermediate term, whose last primary rating was bearish. This now stands at 88.1% with primary ratings as BEARISH and only 11.9% as BULLISH. I guess one can look at this and think that things cannot get much worse but the problem is that nothing says that things cannot stay this bearish for some length of time. Only as the ratings start to change from bearish to bullish will we be seeing a change in market direction.
Merv's Precious Metals Indices Table
Well, that's another week.
By Merv Burak, CMT
Hudson Aero/Systems Inc.
Technical Information Group
for Merv's Precious Metals Central
For DAILY Uranium stock commentary and WEEKLY Uranium market update check out my new Technically Uranium with Merv blog at http://techuranium.blogspot.com .
During the day Merv practices his engineering profession as a Consulting Aerospace Engineer. Once the sun goes down and night descends upon the earth Merv dons his other hat as a Chartered Market Technician ( CMT ) and tries to decipher what's going on in the securities markets. As an underground surveyor in the gold mines of Canada 's Northwest Territories in his youth, Merv has a soft spot for the gold industry and has developed several Gold Indices reflecting different aspects of the industry. As a basically lazy individual Merv's driving focus is to KEEP IT SIMPLE .
To find out more about Merv's various Gold Indices and component stocks, please visit http://preciousmetalscentral.com . There you will find samples of the Indices and their component stocks plus other publications of interest to gold investors.
Before you invest, Always check your market timing with a Qualified Professional Market Technician
Merv Burak Archive |
© 2005-2022 http://www.MarketOracle.co.uk - The Market Oracle is a FREE Daily Financial Markets Analysis & Forecasting online publication.
Comments
|
Maher
07 May 08, 01:17 |
Good Work!
This is by far the BEST piece of "analysis" I have ever read in my life! Great Job Merv! Maher. |