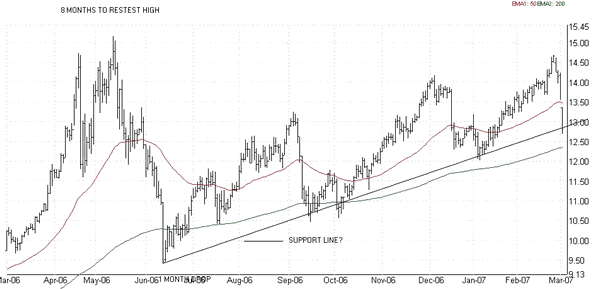
Silver becoming Oversold as it targets the 200 day Moving Average at $12.40
Commodities / Gold & Silver Mar 05, 2007 - 12:08 AM GMTBy: Roland_Watson
If I repeat first of all what I said in last week's update: "Silver could approach the old high of $15 before dropping back to near $14 which will be the last decent buy point before we soar."
That was half right and half wrong. Silver continued on up to a spot intraday high of $14.68 (though the futures got as high as $14.885 on Monday) and then dropped. It did not stop at $14 however. I also suggested:
"I think that silver has only a week or so to test $15 before being pulled back to perhaps its 50 day moving average. When silver moves into a bullish phase, the 50 day moving average takes over from the 200 day moving average as the baseline."
Indeed, it only had one day to test $15 as it peaked the following day! The 50-day moving average (MA) of $13.47 was then quickly visited before it stopped betwixt the 50 and 200 day MAs at $12.82 (see attached chart). Now will it stop below the 50 day MA or go onto the 200 day MA?
I check what had happened when silver dropped below its 50 day MA over the last year or so and it was 3 to 1 in favour of the price continuing onto the 200 day MA. During the last correction after the $8.47 peak, a break below the 50 day MA always continued onto the 200 day MA.

Of course, there is always something to muddy the waters and there are two here. First, the only time the 50 day MA did not go onto test the 200 day MA was the last time it happened on the 18th December! Also, note the trendline I have added which forms an ascending level of support to any drops in the silver price.
However, the RSI is now hovering above oversold territory and we are as close as any price to a buy point. I plan to add some silver this week and my gut feeling is that there is still room for silver to drop and bring us into the 30 or less oversold region. Previous charts show that silver only lingers here for a few days before it takes off again! If you are really risk averse to these low buy points, I suggest you wait until the old $15 high is taken out. An uncomfortable investor needs to enjoy their investment.
One final point, I expect the 50 day MA to "kiss" the 200 day MA just before silver takes off on the next explosive bull phase. I'll keep you informed on that background story.
Our longer term indicators are pretty static just now but we do not expect them to kick in until the next bull phase approaches its end. In next week's newsletter, I'll give some time projections on when I expect that bull run to end and usher in the next major correction.
Not surprisingly, silver and gold have dropped in their inverse leverage over the US dollar. The US Dollar Index is actually down with gold and silver from 84.07 to 83.74 - an unusual week indeed!
Here are the latest numbers on silver as of this weekend (acronyms explained at bottom):
London Silver Fix Price: $13.53 (-$0.75 on week)
NYMEX Spot Price: $12.82 (-$1.73)
RSI: 35.36 (-30.38 on week) ( 70 overbought/30 oversold - short term top-bottom indicator )
RMAR: 1.05 (-0.01) ( 1.30 overbought - monthly to yearly top indicator )
SLI: 1.48 (-0.03) ( 1.80 overbought - multi-year top indicator )
GSR: 48.18 (+0.35) ( 15.00 silver overbought - multi-decade top indicator )
SLD: 2.444 (-0.187 on week)
GLD: 1.648 (-0.096)
RSI: R elative S trength I ndex
RMAR: R elative 200 day M oving A verage ( R efined)
SLI: S ilver L everage I ndicator
GSR: G old to S ilver R atio
SLD: S ilver L everage to US D ollar on a four year rolling basis
GLD: G old L everage to US D ollar on a four year rolling basis
By Roland Watson
http://silveranalyst.blogspot.com
This article is adapted from issue one of The Silver Analyst newsletter.Further analysis and comment on the silver market can be read in the subscriber-only Silver Analyst newsletter described at http://silveranalyst.blogspot.com where readers can obtain the first issue free. Comments and questions are also invited via email to silveranalysis@yahoo.co.uk
© 2005-2022 http://www.MarketOracle.co.uk - The Market Oracle is a FREE Daily Financial Markets Analysis & Forecasting online publication.


