


Crude Oil Prices Set to Double and Double Again!
Commodities / Crude Oil May 20, 2008 - 11:45 AM GMTBy: John_Mauldin

 Goldman Sachs recently forecasted that oil would be at $141 a barrel by the end of the year, and rising to $200 a barrel in the not too distant future. I have seen other forecasts calling for oil to slip significantly under $100 a barrel before starting yet another bull market.
I have written for years that we are not going to run out of oil or energy, just cheap oil. I was just in South Africa, where much of their gas and diesel comes from coal gasification. At one time this was an expensive way to make gas, and South Africans had to pay more for their gas than the rest of the world. Now, it is getting close to "par" to the cost of gas in the US, and is cheaper than gas in Europe.
In this week's Outside the Box, my friend David Galland at Casey Research presents some very troubling thoughts on why oil may rise higher than we think in the next few years. Many of the countries from which the US gets its oil are seeing production fall, not rise. Some of it is political ineptitude, but much of it is from oil production peaking.
Yes, we can move to coal gasification, and the US has centuries of coal for such purposes, but building such plants takes time and capital and political will, the latter of which is in short supply. In the meantime, and until we get a full-blown crisis, oil is going to continue on its path to $200 and higher. But such a rise will not only make gasoline prices higher, it will make a host of new technologies competitive for the first time. The shift in how we make energy is inevitable.
As a quick aside, if we would start a project to build a massive nuclear infrastructure, such as in France, which produces 80% of its energy from nuclear, while at the same time pushing ahead in a Manhattan-type project the development of electric cars (or some hybrid), we could reduce our dependence on foreign oil and lower travel costs by the middle to the end of the next decade. And the environment would be cleaner and safer.
We are headed to such a future. It would be nice if we did it sooner rather than wait for a real crisis. But in the meantime, the price of oil is going to rise and opportunities for investors will rise along with it. My friends at Casey Research publish an excellent newsletter highlighting the opportunities not just in exploration companies but in all manner of energy-related firms. As David writes:
"The good news is that there are no shortage of high-quality energy-related investments available ... in coal, heavy oil, LNG, photovoltaics, natural gas consolidators, "run of river" hydroelectric, uranium and small to mid-cap oil companies with the potential for significant near-term gains in reserves or production."
They have agreed to give my readers a risk-free three-month trial to the Casey Energy Speculator. If you like the research you read below and want more of it, you can click on this link and subscribe .
And now let's see one of the main reasons why the price of oil is going up.
John Mauldin, Editor
Outside the Box
What the Export Land Model Means for Energy Prices
By David Galland,
Managing Director
Casey Research - Casey Energy Speculator
Jeffrey Brown is someone you should know. That's because he can help you understand today's high energy prices and that, as an investor, can make you a lot of money.
I'll introduce to you to Jeff Brown in a moment. But first, as it's relevant to the discussion, I want to touch on an important concept related to investing in challenging times.
You might call it "the Davy Crockett principle" in honor of something that American icon said during the War of 1812: "Be sure you are right and then go ahead."
Simply, it's critical to step away from all the noise and clutter that passes for knowledge on the financial talk shows, and take the time to be very sure you are investing in close concert with a powerful unfolding trend. That accomplished, come what may, you'll come out okay once the dust has settled.
And the earlier you can get on board with a trend, the more money you can make.
In fact, Casey Research chief economist Bud Conrad has shown how, by making just four trades over the last four decades -- into exactly the right sector at the beginning of a strong new trend -- you could have turned $35 into $150,000. Or $350 into $1,500,000 ... or $3,500 into $15 million. And that assumes you don't use leverage. Toss in some options or futures and the returns run exponentially higher. Here's the chart.
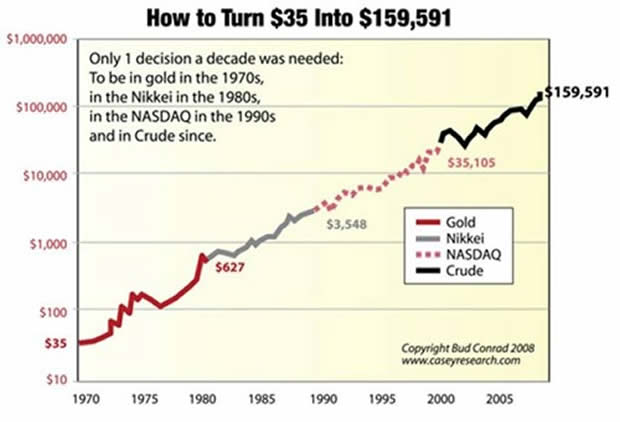
While it is unlikely anyone actually made those exact trades, it is a certainty that many investors got in early on one or more of those big moves.
(Interestingly, replacing the last trade -- the move into crude -- with gold produces a final number of $131,496. Proving there is more than one path to the top.)
The key point I'm trying to make is simple: focusing your investments on big trends is a big leg up in your quest for investment success. By then digging in to find the right opportunities, whether they be in commodities or undervalued companies that benefit from those trends, assures you earn returns that are well above average.
More importantly, in the context of the current market environment, the combination of the right investment in the right trend makes your portfolio bullet-proof.
Which brings me to the work being done by Jeffrey Brown, a professional geoscientist with an avid academic and professional interest in something called the Export Land Model .
Turning off the Taps
You don't have to have an awful lot of gray hair to remember the excitement around England's massive North Sea oil fields. While discovered in 1969, it wasn't until well into the 1980s, on the back of surging oil prices, that the fields came into full production. Turning up the taps, the United Kingdom (as well as Norway and Germany, who also have North Sea production) became a significant exporter of oil.
But then, in 1999, something happened: the UK's North Sea production hit peak ... that tipping point after which reservoirs go into decline, setting in motion both reduced production and progressively higher costs related to extracting the remaining oil.
While the experience of North Sea oil production provides yet another useful example of the validity of the Peak Oil theory, what concerns us today is a critical but usually overlooked aspect of the discussion, exports.
At the time the North Sea peaked in 1999, the U.K. was exporting 1 million barrels of oil per day. By August 2004, it had become a net importer. What happened to cause the situation to turn around so quickly?
The Export Land Model
To understand the importance of exports when discussing peak oil, ask yourself the question, "What's more important: the fact that global oil production is falling ... or that the oil-exporting nations are cutting off their exports?"
While the two questions are clearly linked, it is the nuance of the export question that clearly matters the most. Especially if you live in a country such as the US, which currently imports about 70% of its oil.
Which brings us to the Export Land Model (or ELM, as I will refer to it from here). The basic thesis expressed by Jeff Brown and other students of the ELM is that, to fully appreciate the impact of peak oil, you cannot look only at the production declines so presciently anticipated by MK Hubbard in 1956. You also have to look at the rate of local consumption and the effect of that consumption on the ability of a country to export its oil.
The following ELM graph looks at both sides of the equation, and the result as it applies to exports:
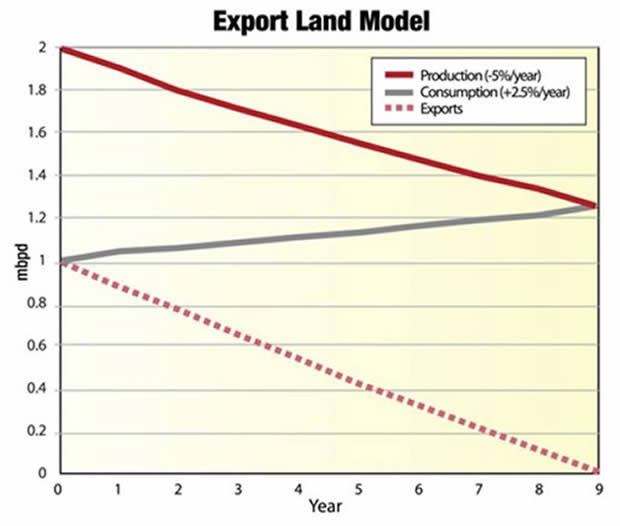
As you can see, for illustrative purposes the ELM assumes that, after a country's oil production hits peak it will decline at a rate 5% annually, at the same time that local consumption increases by 2.5%. The red line then shows the impact those two metrics will have on the ability of the country to export its excess production. Using these assumptions, the ELM shows that exports reach zero in 9 years.
Real-world data shows that the metrics used in the ELM are quite conservative. The chart below plots the hypothetical ELM against the actual data from the United Kingdom and Indonesia. While the ELM forecast hypothesizes 9 years between peak to the end of exports, Indonesia's exports ceased 7 years after peak, and the UK's exports stopped just 6 years after peak.
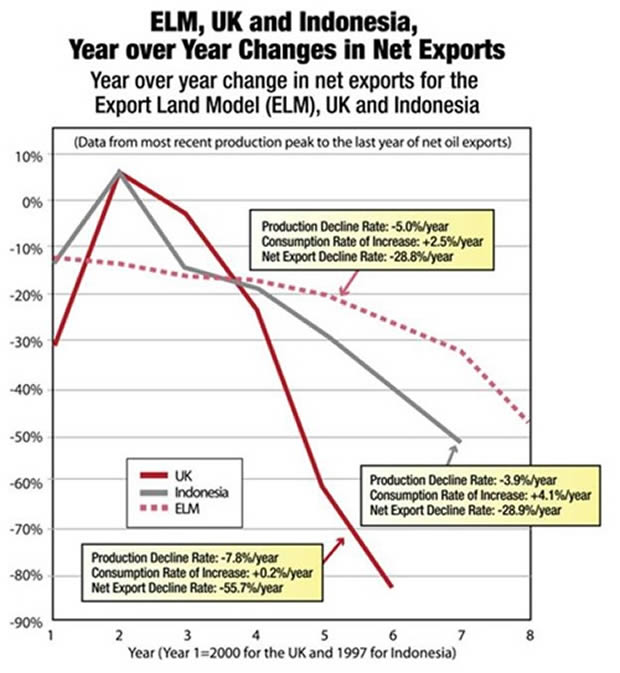
The important take-away here is not that the UK and Indonesia are no longer receiving the oil export income of the good old days -- that is entirely a localized concern.
Rather it is that the global market is now deprived of those exports; between UK and Indonesia alone, the change over just the last decade amounts to a swing in the wrong direction of a total of 2 million barrels per day. And those are just two of a number of important countries which have swung from exporters to importers in recent years.
China, for example, became a net importer in 1993, the result of flattening production against skyrocketing consumption. Over the last decade alone, China's oil consumption has almost doubled, to about 8 million barrels a day, about half of which is now imported.
So, again, while people tend to focus on production, they are overlooking the impact on exports forecasted by the ELM. In the case of China, they went from a net exporter in 1993 to importing 4 million barrels a day today ... with those imports projected to rise another 50% over the next 10 years.
This is what is creating so much international competition for the remaining supplies of oil. And why the trend to higher energy prices is so well entrenched. And if the ELM is right, things are about to get far worse ... far sooner than most people expect.
The #3 Source of Oil to the US Is About to Go Offline
Mexico provides about 14% of the oil the US imports. On any given day that makes it either the #2 or #3 leading source for US oil imports after Canada and Saudi Arabia. Given that the US currently imports close to 70% of its oil needs, the Mexican oil is critical.
But here's the thing. Using straightforward ELM calculations, Jeffrey Brown is confident that Mexico will ship its last barrel of oil to the United States -- or anywhere else, for that matter -- about 6 years from now, in 2014. In a recent interview with Brown, I asked about this forecast.
"Mexico was consuming half of their production at peak in 2004. And if you look at the '05, '06, '07 data, they're basically on track, on average, to approach zero net oil exports no later than 2014," he confirmed.
Of course, the US is completely unprepared to replace this source of oil, especially considering the growing stresses on global oil supplies causing by ballooning demand from emerging markets. That means the international competition for available supplies is only going to get more desperate in the months and years ahead.
What will this mean to oil prices, according to Brown?
"From this point out I think we'll see a geometric progression in prices ... you know, $50, $100, $200, $400, whatever. The only question now is how short the periods will be between prices doubling again."
Coincidentally, while this report was in preparation, on April 30, 2008, PEMEX, Mexico's national oil company, announced it would be unable to fulfill this year's scheduled oil export obligations to the United States ... falling short by about 11%, or 184,000 barrels a day.
(As an aside, I also have to believe that Mexico's coming transition to a net importer and the loss of almost 6% of the country's GDP, now earned from exporting oil, will trigger serious social issues in that country. But that is another story for another day.)
The Even Bigger Picture
In my interview, I also asked Jeffrey to share his thoughts on the situation globally. Here's his response.
"Global production peaked in 2005, and we're now into the third year of decline. And the critical point to keep in mind is, our model and case histories show that the decline rate accelerates, year by year. Using the Lower 48 in the United States as an example, you can see the annual declines going 2%, 3%, 5%, 7%, 10%, 15%, 20, on and on. So it's an accelerating decline rate."
Underscoring Brown's concerns:
- On April 15, 2008 the Russians, the world's second largest oil exporter, announced that their oil production appeared to have peaked, with production in the first quarter of this year declining for the first time in a decade. If they have indeed peaked then, based on the ELM, the world could lose Russia's current ~7 million barrels a day in exports within 6 to 9 years.
- Echoing the baseline premise of the ELM, Herman Franssen, president of International Energy Associates, projects that Iran, the world's fifth largest exporter, may consume an amount equal to their exports by 2015. A prominent oil analyst, the late Dr. Ali Samsam Bakhtiari, estimated that Iran is either at or near peak.
- Most concerning, this April Saudi Arabia's King Abdullah announced they were not going to raise oil production above 12.5 million barrels a day. Commenting on the news, Tom Petrie, vice president of Merrill Lynch, said
"King Abdullah's quote speaks to the fast-emerging reality of what I call 'practical peak oil.' The Saudis and other exporters are placing a new emphasis on elongating the petroleum exploitation and depletion cycle. This stems from a growing awareness of the challenges of conventional resource maturity, as well as rising resource nationalism. This is likely to result in an earlier occurrence of global peak oil output than many consumers yet recognize."
Summing it up, Brown told me that "The reality is that this thing is coming so much faster and so much harder than even most pessimists were expecting."
Rice & Oil: a Useful Comparable
For a useful way to think about energy exports and prices, Jeff Brown points to the current situation with global rice supplies.
As long as there are abundant local supplies, countries are happy, eager in fact, to export excess production in order to generate foreign exchange. But as soon as local consumption exceeds locally available production, then all hell breaks loose, and the next thing you know countries are banning exports, a move that has already been undertaken by Vietnam and a number of other countries.
In that scenario, price is eventually no longer a factor in the availability of the commodity. Vietnam, for example, is not going to let its people starve just because higher global prices would allow it to earn an extra $10 per bag of rice.
And so in the face of the prospect of any serious shortage of an important resource -- energy being maybe the most important - export markets freeze up and the price begins to be set at the margin, literally based on a global competition for the dwindling supplies that manage to leak out around the edges.
"People are crazy not to be focusing on the oil export situation," Dr. Brown told me.
Any White Knights on the Horizon?
Of course, the question of energy alternatives is a big topic and one which needs a far more extensive discussion than space allows for here.
Will viable alternatives be developed to help mitigate a domino collapse of oil exports? Absolutely. Of those alternatives, nuclear, solar, and heavy oil seem to hold the greatest promise.
But the sheer scope of the problem - with the world now consuming the energy equivalent of 1 billion barrels of oil every 5 days - assures that we are probably decades away from a real solution.
In the words of Jeff Brown:
"If you look at the situation in US presidential terms, looking at fossil fuels plus nuclear, the world burned through the equivalent of 10% of all oil ever consumed in Bush's first 4-year term. And, in our model, we're going to burn 10% of all remaining conventional crude in the second 4 years of Bush's term.
"That is the equivalent of around 25 billion barrels a year. So that's 100 billion barrels every four years, and we've burned 1,000 billion barrels. It gets interesting when you consider that current estimates are that we've only got 1,000 billion barrels of conventional crude remaining. I think with natural gas liquids, we've got a little bit more. But of the conventional crude oil, we've got 1,000 billion remaining. Which then begs the question, how fast can we bring on the tar sands and everything else?"
Grasping for straws, I asked Jeff about an article I had read recently about the Bakken oil shale reserves around North Dakota.
"They're talking about somewhere between 200 billion and 500 billion barrels in situ, but the USGS recently came out with a mean estimate of between 2.5 and 4.4 billion barrels recoverable, as an outer limit," he replied, before continuing:
"In 1966 they said, if Lower 48 ultimately recoverable is 150 billion barrels, then the US would peak in 1966. If the recoverable oil from the Lower 48 ultimately came in at 200 billion barrels, then the US peak would come in 1971. The higher-end estimate probably turned out to more accurate, and the U.S. peaked in 1970. But the point is this: a one-third increase of estimated ultimate recoverable - a total increase of 50 billion barrels - postponed the peak by all of 5 years."
Rigging for Persistent High Energy Prices
The trend for sustained higher energy prices appears solidly in motion. If Brown and the ELM are correct, energy prices will double, then double again.
Even if he is wrong and prices don't rise geometrically, the global dogfight to replace declining supplies - decidedly exacerbated by the loss of Mexican and maybe Russian (and ??) exports in the near future - is going to get ugly and expensive.
So, what's the investment angle? Paradoxically, the larger energy companies are probably a bad bet, because they are forced to replace their depleting reserves, which is getting harder and more expensive to do with each passing day.
It is our contention that, because the solutions to the world's energy problems are going to involve a variety of energy sources and technologies, you have to build a portfolio that is equally varied.
That assures you are well positioned to profit from the broader trend, while avoiding the risks of being overly exposed to a single sector. (As an example, solar has had a great run, but most solar plays are now overvalued.)
The good news is that there are no shortage of high-quality energy-related investments available ... in coal, heavy oil, LNG, photovoltaics, natural gas consolidators, "run of river" hydroelectric, uranium, and small to mid-cap oil companies with the potential for significant near-term gains in reserves or production.
In the final analysis, it comes down to two choices: you can either suffer the consequences of persistent higher energy prices, or use the work Jeffrey Brown has done with the Export Land Model as an early warning and get positioned to profit.
The decision is yours, but don't wait long to make it.
David Galland is the Managing Director of Casey Research, publishers of the Casey Energy Speculator , a comprehensive newsletter dedicated to helping individuals and institutions uncover today's most undervalued and compelling energy investments. A no-risk three-month trial subscription is available that allows you to access all current recommendations and to decide for yourself if the service is right for you. Learn more by clicking here now .
Your believing the cure for high prices is high prices analyst,
John F. Mauldin
johnmauldin@investorsinsight
John Mauldin, Best-Selling author and recognized financial expert, is also editor of the free Thoughts From the Frontline that goes to over 1 million readers each week. For more information on John or his FREE weekly economic letter go to: http://www.frontlinethoughts.com/learnmore
To subscribe to John Mauldin's E-Letter please click here:http://www.frontlinethoughts.com/subscribe.asp
John Mauldin is the President of Millennium Wave Advisors, LLC (MWA) which is an investment advisory firm registered with multiple states. John Mauldin is a registered representative of Millennium Wave Securities, LLC, (MWS) an FINRA registered broker-dealer. MWS is also a Commodity Pool Operator (CPO) and a Commodity Trading Advisor (CTA) registered with the CFTC, as well as an Introducing Broker (IB). Millennium Wave Investments is a dba of MWA LLC and MWS LLC. Millennium Wave Investments cooperates in the consulting on and marketing of private investment offerings with other independent firms such as Altegris Investments; Absolute Return Partners, LLP; Pro-Hedge Funds; and Plexus Asset Management. All material presented herein is believed to be reliable but we cannot attest to its accuracy. Investment recommendations may change and readers are urged to check with their investment counselors before making any investment decisions.
Opinions expressed in these reports may change without prior notice. John Mauldin and/or the staffs at Millennium Wave Advisors, LLC and InvestorsInsight Publishing, Inc. ("InvestorsInsight") may or may not have investments in any funds cited above. Disclaimer PAST RESULTS ARE NOT INDICATIVE OF FUTURE RESULTS. THERE IS RISK OF LOSS AS WELL AS THE OPPORTUNITY FOR GAIN WHEN INVESTING IN MANAGED FUNDS. WHEN CONSIDERING ALTERNATIVE INVESTMENTS, INCLUDING HEDGE FUNDS, YOU SHOULD CONSIDER VARIOUS RISKS INCLUDING THE FACT THAT SOME PRODUCTS: OFTEN ENGAGE IN LEVERAGING AND OTHER SPECULATIVE INVESTMENT PRACTICES THAT MAY INCREASE THE RISK OF INVESTMENT LOSS, CAN BE ILLIQUID, ARE NOT REQUIRED TO PROVIDE PERIODIC PRICING OR VALUATION INFORMATION TO INVESTORS, MAY INVOLVE COMPLEX TAX STRUCTURES AND DELAYS IN DISTRIBUTING IMPORTANT TAX INFORMATION, ARE NOT SUBJECT TO THE SAME REGULATORY REQUIREMENTS AS MUTUAL FUNDS, OFTEN CHARGE HIGH FEES, AND IN MANY CASES THE UNDERLYING INVESTMENTS ARE NOT TRANSPARENT AND ARE KNOWN ONLY TO THE INVESTMENT MANAGER.
© InvestorsInsight Publishing, Inc. 2007 ALL RIGHTS RESERVED
John Mauldin Archive |
© 2005-2022 http://www.MarketOracle.co.uk - The Market Oracle is a FREE Daily Financial Markets Analysis & Forecasting online publication.