


How to Identify Stocks to Sell Short
InvestorEducation / Stocks Bear Market May 27, 2008 - 07:18 AM GMTBy: John_Mauldin

 Is the market over-valued? In this week's Outside the Box, one of my favorite global equity analyst's (and no stranger to regular readers), James Montier of Societe Generale does some very interesting analysis on the European and US markets and finds the number of stocks which make his list as possible for being a "short" is at very high levels. This is a remarkable read and re-enforces my view that we are in a "sell in May and go away" summer. This is really a great Outside the Box. Enjoy.
John Mauldin, Editor
Outside the Box
Joining The Dark Side: Pirates, Spies and Short Sellers
By James Montier
Joining the dark side
It never ceases to amaze me that whenever a major corporate declines the short sellers are suddenly painted as financial equivalents of psychopaths. This is madness, rather than examining the exceptionally poor (and sometimes criminal) decisions that the corporate itself took, the short sellers are hauled over the coals.
As the New York Times recently reminded us, vilifying short sellers is nothing new.
In the days when square-rigged galleons plied the spice route to the East, the Dutch outlawed a band of rebels that they feared might plunder their new-found riches.
The troublemakers were neither Barbary pirates nor Spanish spies -- they were certain traders on the stock exchange in Amsterdam. Their offence: shorting the shares of the Dutch East India Company, purportedly the first company in the world to issue stock.
Short sellers, who sell assets like stocks in the hope that the price will fall, have been reviled ever since. England banned them for much of the 18th and 19th centuries. Napoleon deemed them enemies of the state. And Germany's last Kaiser enlisted them to attack American markets (or so some Americans feared).
Jenny Anderson, NY Times, 30 April 2008
Last week, Albert Edwards took our equity weighting down to its minimum (see Global Strategy Weekly, 8 May 2008), and my own bottom-up valuation work finds little opportunity for investment at the moment (see Mind Matters, 28 January 2008). This suggests to me the main opportunities may lie on the short side in the current market. So I guess I am joining the ranks of the dark side!
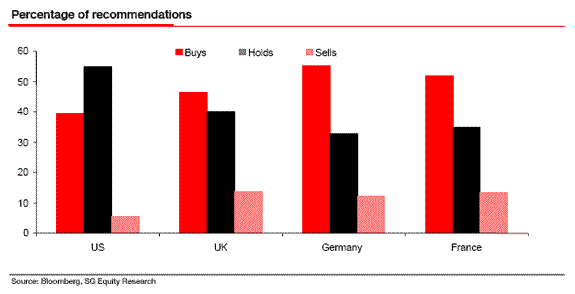
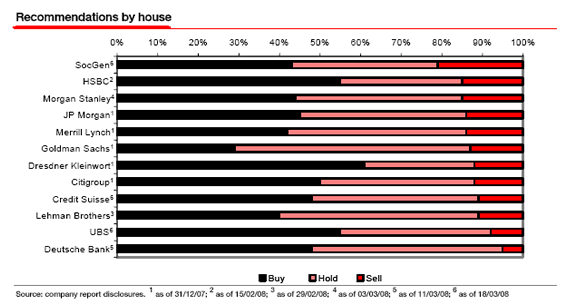
This remains anathema to analysts. As the chart below shows the percentage of sell recommendations remains pathetically low. Indeed, the other day my head of research showed me the second chart below showing that SG had the highest percentage of sells amongst investment banks - it makes a pleasant change to see SG at the top of a list on a positive note!
All of this got me to thinking about how to identify potential short candidates. In keeping with my first note for SG (on limited information - see Mind Matters 3 December 2007, I want to focus on just a few key measures that stand out to me as sources of poor underperformance.
Valuation
Most obviously (and unsurprisingly given my value bias) one of my primary sources of underperformance has to be high valuation. There are myriad methods of valuing a stock, of course. However, from the perspective of a short seller, one of the most useful is price-to-sales.
Focusing upon high price-to-sales stocks allows us to hone in on story stocks - those stocks that have lost all touch with reality. During periods of investor enthusiasm there is often a marked tendency to move up the income statement in order to try and keep valuation multiples 'low'. Indeed during the dotcom years, things were valued on measures such as average revenue per user, clicks and eyeballs!
Price-to-sales has always been one of my least favourite valuation measures as it ignores profitability. Reductio ad absurdum demonstrates this clearly. Imagine I set up a business selling £20 notes for £19, strangely enough I will never make any money, my volume may well be enormous, but it will always be profitless. But I won't care as long as the market values me on price-to-sales.
I am not alone in pondering the insanity of this measure. One of my favourite quotations of all time comes from Scott McNealy, the then CEO of Sun Microsystems:
But two years ago we were selling at 10 times revenues when we were at $64. At 10 times revenues, to give you a 10-year payback, I have to pay you 100% of revenues for 10 straight years in dividends. That assumes I can get that by my shareholders. That assumes I have zero cost of goods sold, which is very hard for a computer company. That assumes zero expenses, which is really hard with 39,000 employees. That assumes I pay no taxes, which is very hard. And that assumes you pay no taxes on your dividends, which is kind of illegal. And that assumes that with zero R&D for the next 10 years, I can maintain the current revenue run rate. Now, having done that, would any of you like to buy my stock at $64? Do you realize how ridiculous those basic assumptions are? You don't need any transparency. You don't need any footnotes. What were you thinking ?
Scott McNealy, Business Week, April 2002.
So whenever I hear people using price-to-sales to justify a stock I can't help but think they are trying to hide something. However, as always I remain a proponent of Evidence Based Investing, so the proof is in the pudding. Does price-to-sales work as a strategy?
The chart below shows the performance of price-to-sales quintiles within Europe over the period 1985-2007. Unsurprisingly, the cheapest stocks outperform the most expensive stocks.
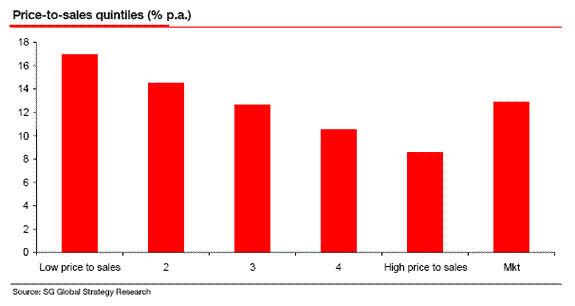
As a check on this particular valuation measure we regressed the returns from a long short price-to-sales portfolio against the value minus growth returns from MSCI Europe. A significant 'alpha' was found, so price-to-sales adds something extra above and beyond price-to-book (as per the discussion above).
Financial Analysis
The second element of my short strategy is to examine the financial analysis of the company. My outspoken criticism of analysts is sometimes taken as a view that I think financial analysis is a waste of time. Nothing could be further from the truth. I am driven to despair by the fact that analysts spend so long wasting their time trying to do the impossible such as forecast earnings, but I remain a fan of good solid fundamental-orientated research.
In the past I have advocated the use of the F score designed by Joseph Piotroski as a simple but highly effective method of quantifying a fundamental approach. In his original paper 1 , Piotroski applied a fundamental analysis screen to help tell good value from value traps. In a subsequent paper 2 , he explored whether a simple financial screen could enhance performance across a variety of styles.
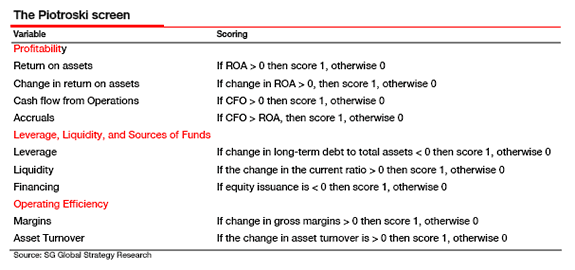
The screen Piotroski developed is a simple nine input accounting-based scoring system. The table below shows the basic variables used in its calculation. Effectively, Piotroski uses indicators based on three areas of financial analysis in order to assess the likelihood of an improving fundamental backdrop.
Current operating profits and cash flow outturns obviously provide information about the firm's ability to generate funds internally, and pay dividends. A positive earnings trend is also suggestive of an improvement in the fundamental performance of the firm. Earnings quality is also captured by looking at the relationship between cash flows and reported earnings.
The next three measures are designed to measure changes in the capital structure and general ability to meet debt-service obligations. If you like, these measures assess the likelihood of bankruptcy and bring the balance sheet into the overall score.
The last two elements of the overall F score are concerned with operating efficiency. The variables used will be familiar to fans of Du Pont analysis as they both come from traditional decomposition of ROA. Having assessed the measures as per the table below, a firm's F score is simply the summation of the various individual components (thus it is bounded between 0 and 9).
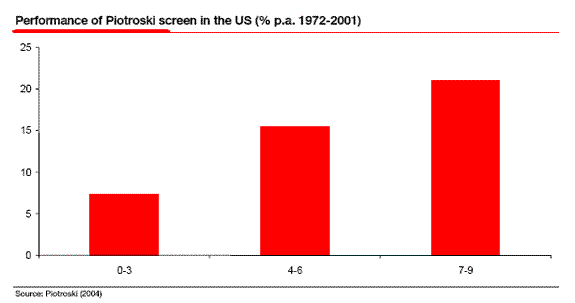
Piotroski examines the performance of this score in the US market over the period 1972 to 2001. His main findings are shown in the chart below which maps out raw returns by the overall F score. The average raw (market adjusted) return for firms with low F scores (0-3) is 7.3% p.a. (-5.5%). Firms with medium F scores (4-6) show raw (market adjusted) returns of 15.5% p.a. (3%). Those firms with the highest F score (7-9) showed an average raw return (market adjusted) of 21% p.a. (7.8%). This certainly shows that fundamental analysis can be a source of alpha!
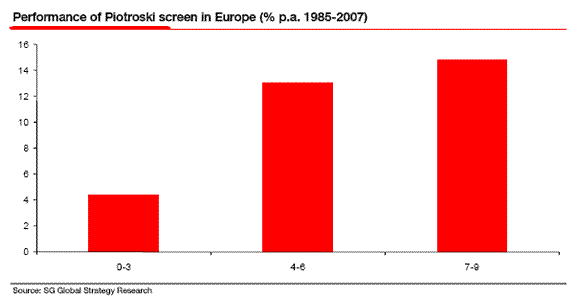
I find the European evidence to be similar. The average raw (market adjusted) return for firms with low F scores (0-3) is 4.4% p.a. (-8%). Firms with medium F scores (4-6) show raw (market adjusted) returns of 13.1% p.a. (0.5%). Those firms with the highest F score (7-9) showed an average raw return (market adjusted) of 15% p.a. (2.5%).
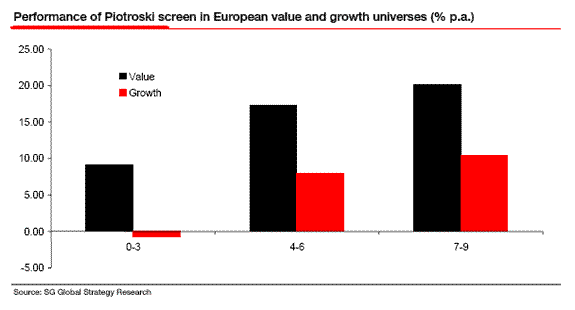
Piotroski also explores how his measure performs in the context of value and growth stocks. As he notes:
It is very difficult for investors to systematically identify meaningfully underpriced (overpriced) glamour firms (value firms), consistent with the gains to financial statement analysis-based strategies corresponding to the expected bias imbedded in each book-to-market portfolio. When FSCORE corresponds to the expected performance of these firms (i.e. strong performance for glamour and poor performance for value firms), each respective portfolio earns near the market return. Effectively, financial signals confirming the expectations that are likely already imbedded in price are assimilated into prices quickly, while contrarian signals are (generally) discounted until future confirmatory news is received. As a result, historical good news for glamour firms is unable to generate excess returns, while historical good news for value firms is a tradable opportunity, and vice-versa for trading opportunities conditional on bad news.
This finding is confirmed by our European data as the chart below shows. Value stocks with high F scores do particularly well (a raw return of over 20% p.a., some 4% better than the average value stock). However, growth stocks with low F scores do particularly poorly (a raw return of -.7% p.a., some 9% worse than the average growth stock).
In the context of our combing for short candidates, this implies we would be best off looking at expensive stocks, so combining the first two components should give a reasonable list of likely short candidates. However, I wish to examine one more important factor before producing a final list.
Capital discipline
The final element of my hunt for potential shorts is a lack of capital discipline. A survey conducted by McKinsey 3 (at last something useful from them!) revealed that corporates themselves knew that they weren't great at capital discipline. The survey of "Corporate level executives" said "17 percent of the capital invested by their companies went toward underperforming investment that should be terminated and that 16 percent of their investments were a mistake to have financed in the first place". Those working closer to the coal face (business unit heads and frontline managers) thought that even more projects should never have been approved (21% for each category!).
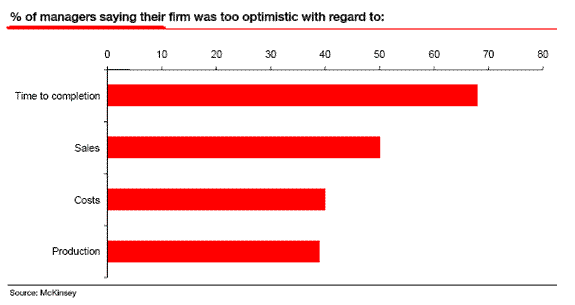
The survey also asked managers how accurate their forecasts were in various areas of corporate investment such as the time taken to complete the project, the impact on sales, costs etc. The results are shown in the chart below. Nearly 70% of the managers said they were too optimistic with respect to the time the project would take to complete (evidence of the well known planning fallacy). 50% of the respondents said they were too optimistic about the impact the investment would have on sales, and over 40% were too optimistic about the costs involved!
The survey also revealed that nearly 40% of the respondents said that managers "hide, restrict, or misrepresent information" when submitting capital investment proposals! The discouragement of dissent was also strongly noted, over 50% of those taking part said it was important to avoid contradicting superiors (see Mind Matters, 5 March 2008).
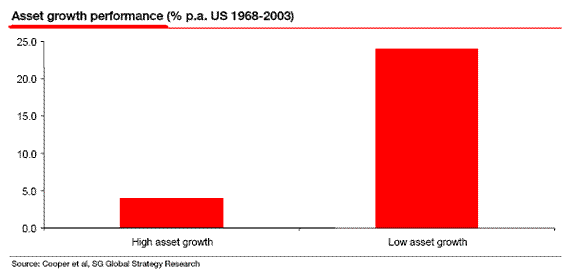
Given these kind of views, it isn't shocking to note the findings of Cooper, Gulen and Schill 4 . They explore the predictive power of total asset growth for stock returns. The advantage of using total assets is, of course, that it provides a comprehensive picture of overall investment/disinvestment.
In their US sample covering the period 1968-2003, Cooper et al find that firms with low asset growth outperformed firms with high asset growth by an astounding 20% p.a. equally weighted. Even when controlling for market, size and style, low asset growth firms outperformed high asset growth firms by 13% p.a.
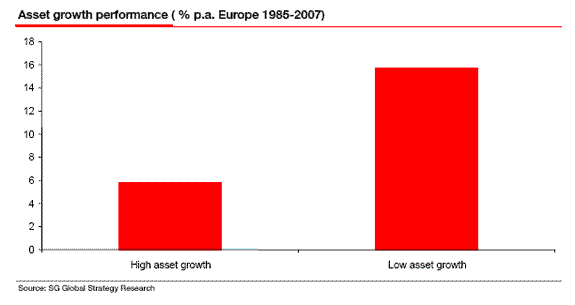
The European evidence is also compelling. Over the period 1985 to 2007, we find that low asset growth firms outperformed high asset growth firms by around 10% p.a. The bottom line is that capital discipline seems to be much neglected by firms and investors alike.
Putting it all together
So we have covered three potential sources of short ideas. What happens if we put them all together? The parameters I used to define my shorts were a price-to-sales > 1, an F score of 3 or less, and total asset growth in double digits.
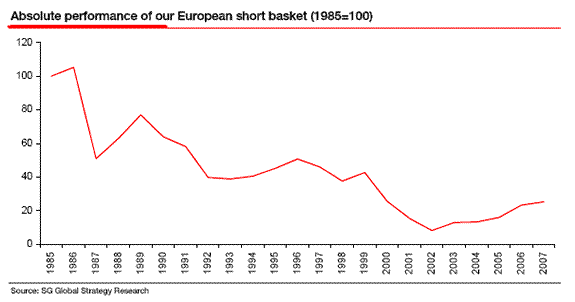
This proved to be a powerful combination. Between 1985 and 2007 a portfolio of such stocks rebalanced annually would have declined over 6% p.a. compared to a market that was rising at the rate of 13% p.a. in Europe! Although I've not shown the result below, similar findings were uncovered for the US as well.
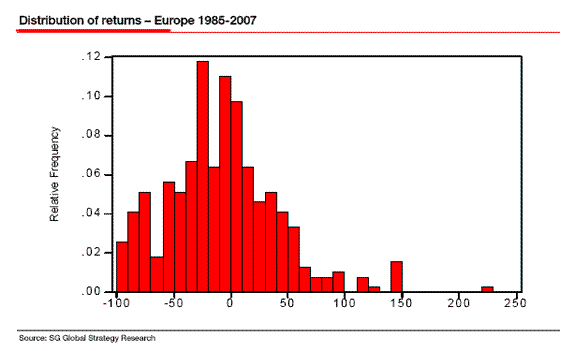
The basket of shorts generated a negative alpha in excess of 20% p.a. with a beta of 1.3. The basket witnessed absolute negative returns in 10 out of 22 years (45% of the time). Relative to the index it underperformed in 18 of the 22 years (81% of the time).
The average stock selected by the model falls 8% p.a. (median 9.6% decline). Some 60% of the screen picks witness absolute negative returns. Thus the model also tends to pick a few stocks that do exceptionally well on the long side - not good news for a short strategy. Hence, introducing the use of stop loss can improve the performance of our short basket significantly. For instance, putting a 20% stop loss in place raises the return from -6% p.a. to -13% p.a.
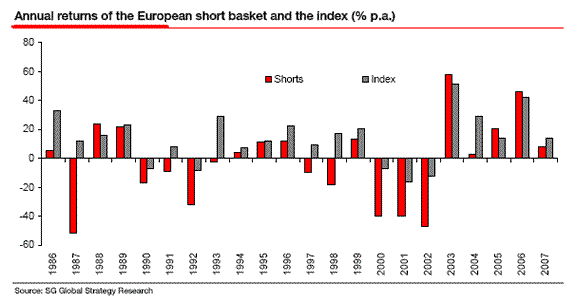
As regular readers will know I have described much of the period since late 2002 as being characterised by the dash to trash. This can clearly be seen from the chart above. 2003 saw the shorts outperforming the market by 6%! A feat repeated on a lesser scale in 2005 and 2006.
Despite the rocky road that this portfolio has suffered in recent years, I believe that it remains a sound method of looking for shorts, and if we are right that most of the opportunities are likely to be on the short side then it could prove a useful tool in the times ahead.
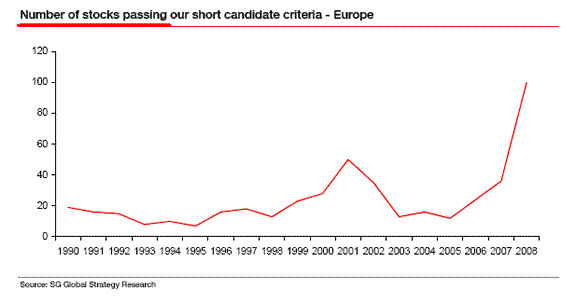
Two final charts which echo one of the points I made at the outset of this note are shown below. They illustrate the number of stocks that the screen finds passing our criteria for being short candidates. In Europe, the average over our sample is around 20 stocks per year. Running the screen now reveals an all time high of almost 100 stocks passing the criteria.
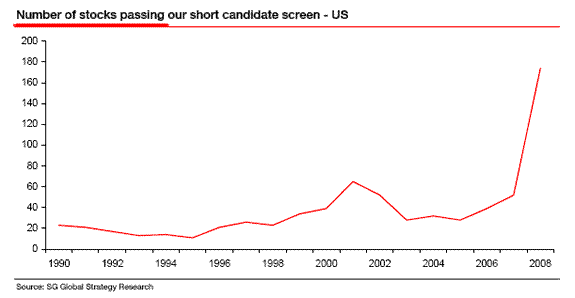
In the US, the average number of stocks in our short basket is around 30. Today, the screen finds no less than 174 stocks passing the criteria. This clearly demonstrates to me the lack of value I alluded to at the start of this note, and indeed suggests that the opportunities are now firmly on the short side.
Footnotes:
1 Piotroski (2000) Value Investing: The Use of Historical Financial Information to Separate Winners from Losers, The Journal of Accounting Research, Vol 38
2 Piotroski (2004) Further evidence on the relation between historical changes in financial conditions, future returns and the value/glamour effect, unpublished working paper
3 How Companies Spend Their Money: A McKinsey Global Survey, McKinsey Quarterly June 2007
4 Cooper, Gulen and Schill (2006) What best explains the cross-section of stock returns? Exploring the asset growth effect; available from www.ssrm.com
Your enjoying the holiday analyst,
John F. Mauldin
johnmauldin@investorsinsight
John Mauldin, Best-Selling author and recognized financial expert, is also editor of the free Thoughts From the Frontline that goes to over 1 million readers each week. For more information on John or his FREE weekly economic letter go to: http://www.frontlinethoughts.com/learnmore
To subscribe to John Mauldin's E-Letter please click here:http://www.frontlinethoughts.com/subscribe.asp
John Mauldin is the President of Millennium Wave Advisors, LLC (MWA) which is an investment advisory firm registered with multiple states. John Mauldin is a registered representative of Millennium Wave Securities, LLC, (MWS) an FINRA registered broker-dealer. MWS is also a Commodity Pool Operator (CPO) and a Commodity Trading Advisor (CTA) registered with the CFTC, as well as an Introducing Broker (IB). Millennium Wave Investments is a dba of MWA LLC and MWS LLC. Millennium Wave Investments cooperates in the consulting on and marketing of private investment offerings with other independent firms such as Altegris Investments; Absolute Return Partners, LLP; Pro-Hedge Funds; and Plexus Asset Management. All material presented herein is believed to be reliable but we cannot attest to its accuracy. Investment recommendations may change and readers are urged to check with their investment counselors before making any investment decisions.
Opinions expressed in these reports may change without prior notice. John Mauldin and/or the staffs at Millennium Wave Advisors, LLC and InvestorsInsight Publishing, Inc. ("InvestorsInsight") may or may not have investments in any funds cited above. Disclaimer PAST RESULTS ARE NOT INDICATIVE OF FUTURE RESULTS. THERE IS RISK OF LOSS AS WELL AS THE OPPORTUNITY FOR GAIN WHEN INVESTING IN MANAGED FUNDS. WHEN CONSIDERING ALTERNATIVE INVESTMENTS, INCLUDING HEDGE FUNDS, YOU SHOULD CONSIDER VARIOUS RISKS INCLUDING THE FACT THAT SOME PRODUCTS: OFTEN ENGAGE IN LEVERAGING AND OTHER SPECULATIVE INVESTMENT PRACTICES THAT MAY INCREASE THE RISK OF INVESTMENT LOSS, CAN BE ILLIQUID, ARE NOT REQUIRED TO PROVIDE PERIODIC PRICING OR VALUATION INFORMATION TO INVESTORS, MAY INVOLVE COMPLEX TAX STRUCTURES AND DELAYS IN DISTRIBUTING IMPORTANT TAX INFORMATION, ARE NOT SUBJECT TO THE SAME REGULATORY REQUIREMENTS AS MUTUAL FUNDS, OFTEN CHARGE HIGH FEES, AND IN MANY CASES THE UNDERLYING INVESTMENTS ARE NOT TRANSPARENT AND ARE KNOWN ONLY TO THE INVESTMENT MANAGER.
© InvestorsInsight Publishing, Inc. 2008 ALL RIGHTS RESERVED
John Mauldin Archive |
© 2005-2022 http://www.MarketOracle.co.uk - The Market Oracle is a FREE Daily Financial Markets Analysis & Forecasting online publication.