


Stock Market Downtrend Underway
Stock-Markets / Stock Markets 2014 Dec 13, 2014 - 06:29 PM GMTBy: Tony_Caldaro

 A nasty week in many markets worldwide. The week started off with a gap down opening after closing last week at SPX 2075. It had another gap down opening on Tuesday, then a third gap down on Wednesday hitting SPX 2024. Thursday the market reversed the volatility with a gap up and hit SPX 2056. Then Friday resumed the turbulence to the downside with another gap down opening, and market ended the week at its low SPX 2002. For the week the SPX/DOW lost 3.65%, the NDX/NAZ lost 2.65%, and the DJ World index lost 3.60%. Economic reports for the week were biased to the upside. On the uptick: wholesale/business inventories, retail sales, consumer sentiment, the WLEI, plus weekly jobless claims and the budget deficit improved. On the downtick: export/import prices, the PPI, and the monetary base. Next week lots of action. Highlights include the FOMC meeting, Industrial production, Housing, and Options expiration.
LONG TERM: bull market
Two weeks ago we presented three potential long term counts and posted them on the SPX/DOW/NAZ charts. We gave the probabilities of each of these counts a 40%-30%-30% rating. Last week we discussed the five longest bull markets going back to the year 1885. Three of which have occurred during the last three bull markets, with the current one the third longest in history. We also noted, and gave our Fibonacci reason, should the market make all time new highs in 2015 it will likely make all time new highs in 2017 as well.
Naturally, we will have to wait until at least next month to see if the latter occurs. However, based upon additional historical analysis we are upgrading the count posted on the SPX charts to 50%, leaving the count posted on the DOW charts at 30%, and downgrading the count posted on the NAZ charts to 20%. Since both the SPX count and DOW count suggest Primary V, to end this bull market, is not underway yet. This allows us to expect new highs in 2015, maybe in 2016, and possibly in 2017 as well. We have already worked out a potential scenario going forward. However, we will have to see what unfolds during the next month or so before going public with it.
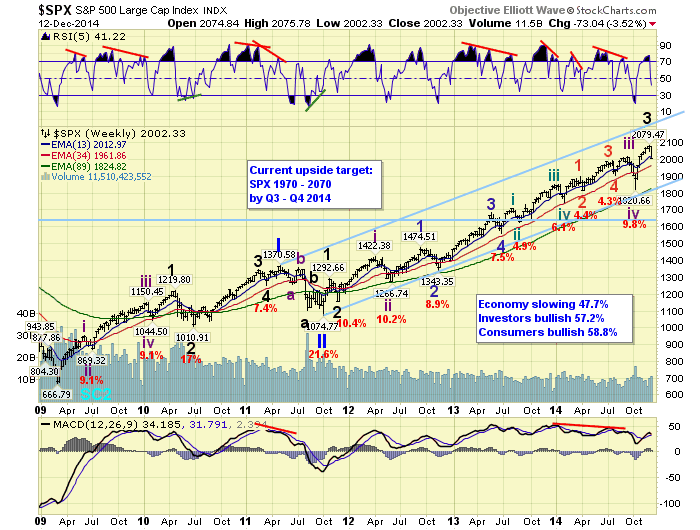
For now the weekly SPX chart displays our favored wave count of an extending Primary wave III. You will notice Primary waves I and II ended in 2011, and Primary III is already three years long. This count suggests Intermediate v/Major wave 3 may have topped at the recent SPX 2079 high in December, and possibly Major wave 4 is underway now. Should Major wave 4 be underway, we would expect a correction similar to Major wave 2 (10%). However, since this Primary wave has had a tendency to keep subdividing we cannot rule out a smaller correction, like only 5%, if Intermediate wave v subdivides.
MEDIUM TERM: downtrend underway
From the Intermediate wave iv downtrend low at SPX 1821 in October, we counted five Minor waves up into the recent high at SPX 2079: 1898-1878-2046-2030-2079. We observed Minor wave 1 as a simple wave. Minor wave 3 divided into five waves of its own: 2024-2001-2041-2032-2046. Then a choppy Minor wave 5 with two potential patterns. The first of these two patterns looked like a diagonal triangle. The second, a complex pattern which we displayed on a five minute chart last week. Under either scenario we determined that the SPX 2050 level was important support for the uptrend. And, SPX 2066 would be important support for the complex Minor 5 pattern.
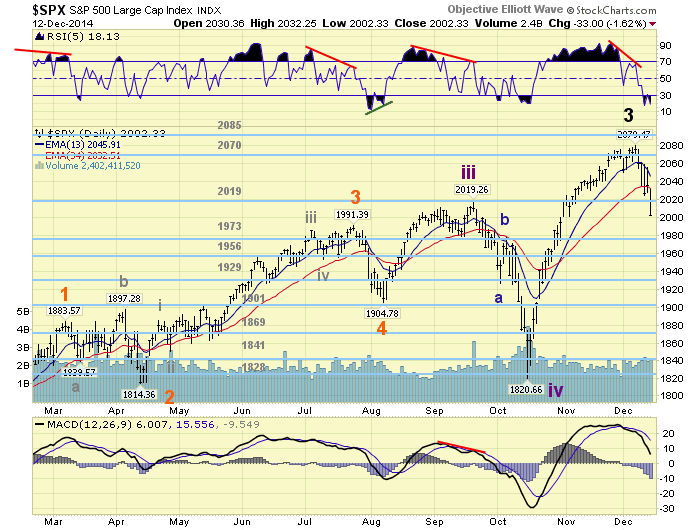
On Monday, this week, the market gapped down at the open, then broke through the first important level (2066) about halfway through the session. This was the first warning of a potential uptrend top at SPX 2079. On Tuesday the market gapped down again, breaking through the important SPX 2050 level right at the open. We then started tracking the price movement as if a downtrend was underway. Thus far, the market has nearly fully retraced the entire advance from early November into early December (2001-2079), in just one week, when it hit SPX 2002 on Friday. The downtrend underway scenario looked quite convincing at that point, and it was confirmed. Medium term support is now at the 1973 and 1956 pivots, with resistance at the 2019 and 2070 pivots.
SHORT TERM
Our upside target for this uptrend was met a bit more than two weeks ago when the SPX hit the 2070 pivot. We had calculated some time ago the uptrend should top within the 2070 or 2085 pivot ranges, with the Fibonacci cluster at SPX 2078 to 2084 as most likely. With the uptrend topping at SPX 2079, Minor 5 (2030-2079), during this uptrend, was a near perfect 0.618 relationship to Minor 1 (1821-1898).
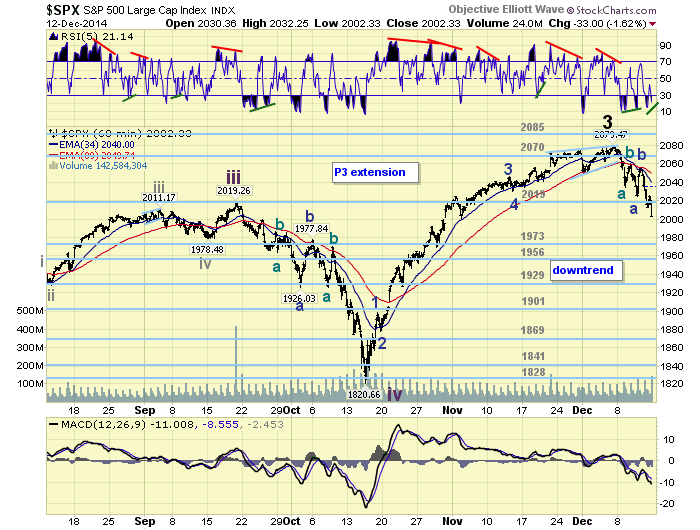
This week we posted a tentative green Major wave 3 label on the SPX hourly chart at SPX 2079. As the expected downtrend started to unfold we started labeling the waves as if it was a Major wave 4 correction. Thus far we have observed five waves down to SPX 2034 and labeled it Minute wave a. Then a Minute wave b rally to SPX 2061. This was followed by a straight down decline to SPX 2024 to end Minute wave c/Minor wave a. We then had a three wave rally to SPX 2056 for Minor wave b. After that Minor wave c was underway.
Thus far we have counted five waves down to SPX 2012, Friday’s low, and labeled it Minute wave a. From that low Minute wave b should have been underway. But the rally only carried to SPX 2025, well short of expectations for a Minute b. Then the market headed lower, dropping through SPX 2012, and hitting 2002 at the close. Now it looks like wave 1 of Minute a was five waves to SPX 2012, wave 2 rallied to 2025, and wave 3 of Minute a is underway. This short term pattern suggests Minute a could hit the 1973 pivot range before ending. A Minute b wave rally should then follow, possibly back to the 2019 pivot range, then a Minute c wave decline to end Minor c/Intermediate A. If Intermediate wave v is subdividing, the last low, expected to be Int. A, could be the end of the correction. Under either scenario, a fairly decent rally should follow the next important low. Short term support is at the 1973 and 1956 pivots, with resistance at SPX 2019 and 2070. Short term momentum ended the week oversold, with a potential positive divergence.
FOREIGN MARKETS
Asian markets were mostly lower for a net loss of 2.0%.
European markets were all deeply lower for a net loss of 7.9%.
The Commodity equity group were also solidly lower for a net loss of 8.2%.
The DJ World index is down trending and lost 3.6%.
COMMODITIES
Bonds are still down trending, but gained 0.9% as yields are down trending too.
Crude remains in a downtrend and lost 12.4% on the week alone.
Gold is up trending and gained 2.5% on the week.
The USD looks like it is headed into a downtrend as it lost 1.2% on the week.
NEXT WEEK
Monday: the NY FED at 8:30, Industrial production at 9:15, then the NAHB at 10am. Tuesday: Housing starts and Building permits. Wednesday: the CPI and the FED ends its FOMC meeting. Thursday: weekly Jobless claims, the Philly FED, and Leading indicators. Friday: Options expiration. Best to your weekend and week!
CHARTS: http://stockcharts.com/public/1269446/tenpp
http://caldaroew.spaces.live.com
After about 40 years of investing in the markets one learns that the markets are constantly changing, not only in price, but in what drives the markets. In the 1960s, the Nifty Fifty were the leaders of the stock market. In the 1970s, stock selection using Technical Analysis was important, as the market stayed with a trading range for the entire decade. In the 1980s, the market finally broke out of it doldrums, as the DOW broke through 1100 in 1982, and launched the greatest bull market on record.
Sharing is an important aspect of a life. Over 100 people have joined our group, from all walks of life, covering twenty three countries across the globe. It's been the most fun I have ever had in the market. Sharing uncommon knowledge, with investors. In hope of aiding them in finding their financial independence.
Copyright © 2014 Tony Caldaro - All Rights Reserved Disclaimer: The above is a matter of opinion provided for general information purposes only and is not intended as investment advice. Information and analysis above are derived from sources and utilising methods believed to be reliable, but we cannot accept responsibility for any losses you may incur as a result of this analysis. Individuals should consult with their personal financial advisors.
Tony Caldaro Archive |
© 2005-2022 http://www.MarketOracle.co.uk - The Market Oracle is a FREE Daily Financial Markets Analysis & Forecasting online publication.