


Gold And Silver - Monthly, Quarterly Ending Analysis
Commodities / Gold and Silver 2015 Jul 01, 2015 - 12:49 PM GMTBy: Michael_Noonan

 While not many pay any attention to these two larger time frames, especially the Quarterly, both are more controlling and receive greater attention from smart money players. These time frames are not at all used for market timing, but they do show the dominance of a trend. It also takes considerably more effort to effect changes on either or both.
There is no need to reference any news events because current events cannot alter the established trends, and the collective current events of the past several years have done nothing to change the trend. We take that back. For the last year, while the overall trend has been down, price has been relatively neutral in the sense of moving sideways instead of lower. That noted aspect is actually a change in behavior, and it is more evident on the silver chart.
As an editorial aside, while most of the world is focused on the Greek debt farce, what is not grabbing anyone's attention is the much, much bigger farce known as the EU, now being exposed for its empty threats against Greece for that country's refusal/inability to repay its purported debt. Tsipras is exposing the toothless Wizard behind the [debt] curtain, huffing and puffing meaningless demands, "or else!" [The "or else!" especially coming from Merkel, day after day, again to no effect.]
What the world is not seeing is exactly how the Debt Emperor is wearing no clothes! There is no way these bureaucratic clowns can enforce anything, and if they cannot control a tiny, defenseless country like Greece, then for EU, BIS, and all other alphabet-types that are a part of the debt meister's enclave, it is game over. The only reason why it is not game over is the public does not get it. They do not understand all the banks are bank-rupt, and Greece is exposing the Ponzi scheme. Take a closer look at what is going on, [Greece], and what is not going on [EU's inability to do a damn thing about getting "repaid."]
Repaid? What did they lend to Greece? Imaginary digitalized fiat [as in not real] "currency." If Greece were smart, it would repay what was received...simply send back the full amount, plus interest, in the form of digitalized blips to the EU. That would balance what the EU/IMF "loaned" to Greece and getting what was "loaned" returned in full.
Play the same game, Greece. No bank in the Western world has anything of substance to lend, except digitalized computer entries created out of thin air. Greek people [and the rest of the debt-enslaved world] are suffering financially over computer entries? Come on, world, Greece is pulling back the curtain and no one is looking!
If you grasp the significance of this, you have every reason to be worried. The elites have been running the biggest con game ever, and it is accomplished by keeping people ignorant. Of what?
Where to begin? Everything and anything that is real and important. Take money, and the elites especially want you to take theirs because it is imaginary and worthless, and they demand substance in return payment. That is the "money" game in a nut shell. Very few know what money is, and just as importantly, what it is not.
Money, in the ordinary acceptation, means gold or silver. It can be paper currency as a medium of exchange IF the paper is backed by gold or silver, otherwise, it is simply fiat.
Money cannot be notes, bonds, or debt. What is the ONLY thing issued by every bank in the world? Fiat notes, actually debt instruments, and that is exactly what Federal Reserve Notes are, commercial debt instruments. They are not Federal; there are no reserves; and they are not notes. There is no promise to pay anyone anything at any point in time.
All fiat issue, regardless of source, BIS, IMF, central banks, et al, are simply either worthless paper, a very small percentage for circulation, and the largest form is the much more easily created computer entries, blips that magically appear in one's account. All of whatever is created is debt. We have said this before, and we repeat again, DEBT, by its very definition CANNOT BE MONEY. It is the opposite of money. What you have in your pocket that you THINK is "money" is debt, pure and simple.
The bankers have conned the world for over a century in the US, a few centuries in the UK and now the EU. By default, [by accident], Greece has become the tip of the debt iceberg by going into actual default.
This does not show up in the charts, for nothing of news substance that is obviously favorable to both gold and silver [like the unprecedented demand side for both and the precarious supply side especially for silver], none of this has impacted the market as would be expected, i.e., higher prices. No, no. The bankers have even openly admitted to actively suppressing the price of gold for at least the last 50 years.
How much lower can price go? $15.50 for silver, and $1,175 for gold. Will either go that low? The probability is next to zero. How high can either go? If the bankers ever lose control, and they are on the precipice of doing so, the upside potential can be staggering. Will this happen? Probably not. People are satisfied to have their fake money believing that everything will be okay. At least, that is what they are told by the bankers, and they believe it.
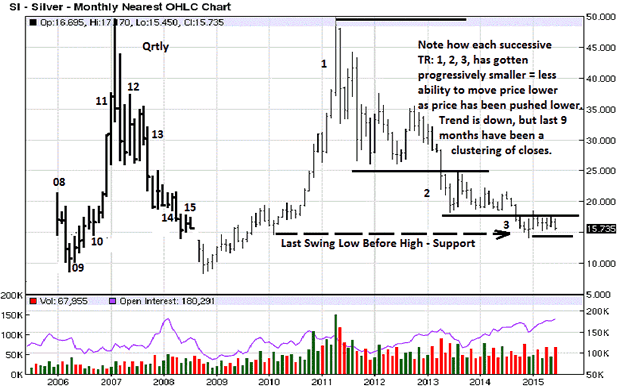
The monthly silver chart shows how the effort to keep price suppressed is reaching or has reached a breaking point. The net gains to the downside are smaller and smaller as can be seen by comparing the 3 different TRs [Trading Range].
We are huge advocates in understanding and appreciating the power of a trend, and the trend is down for both silver and gold. However, the transition from a clear trend down, seen in TR 1, is vastly different from the non-trend of TR 3, where price has moved sideways for the last 9 months, and counting. The closes have also clustered.
What we know about closes that cluster is they represent one of two possibilities, moving forward. The first is a pause before continuing the trend, which would put silver lower, yet again. The second possibility is for a reversal of trend. It is a way for buyers to absorb all the selling, which prevents price from going lower. Because it takes time for buyers to overcome the downward momentum of the trend, they need time to reverse the trend, and that is why price moves sideways to accommodate the pending shift in direction.
Price has returned to the LLBH [Last Low Before High], and we drew a horizontal line from the swing low and referenced it as support. Markets are always testing/retesting all support/resistance areas, regardless of time. Last December, 2014, price retested the low from 2010. You can also see it on the Qrtly chart, at "10." What is important is to observe HOW price responds to the test/retest. In this instance, price broke support around 18 in October 2014 on the way to the December retest. What happened on the retest? So far, price has held. It stopped going lower and has moved sideways. In a down trend, one would expect support to not hold. Support did not hold in TR 2, which led to the current lower TR 3, but the lack of sellers to take price lower stands out when comparing the 3 TRs.
Looking at the Qtr closing for 30 June, the range is small, directionless, and just think of the news events that have transpired each day, each week, each month, so much bad news, so much negativity, world stress, etc. If you knew nothing about the news and just looked at the small range, you would surmise that all must be tranquil in the world to have so little impact on price for the past 3 months.
We do not guess or "predict" what may happen in the future. Anyone who does is selling snake oil under the guise of an informed/educated guess, and more than likely prior 'informed/educated" guesses have been wrong, so stop falling for the "predictors" and their nonsense, no matter who the source, no matter how well intended. Let the market go where it will and follow its lead. That way, you are following a proven fact.
For now, buyers have not yet met the burden for a change in trend. At the same time, sellers are at risk of losing control to the buyers is the sellers cannot move price lower and keep it lower.
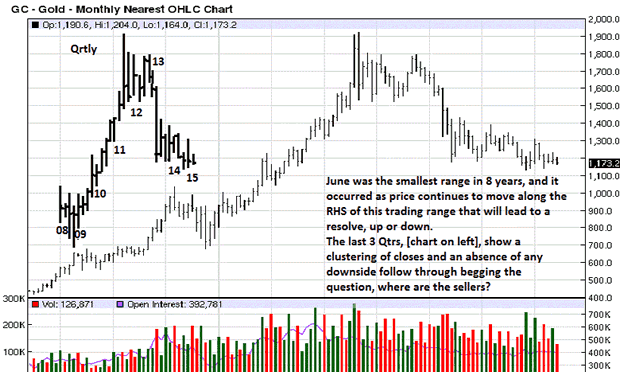
The discussion in silver equally applies for gold. the chart is slightly different, a little more positive by not having formed a lower third tier TR as silver has.
What we know about TRs is that the farther they move along the RHS [Right Hand Side], the closer the TR is to reaching a directional resolve, higher or lower. We do not yet see a tipping point, but the tiny range for the Qtr just ended more than likely will lead to a much broader TR for the next Qtr. The tight clustering of closes on the Qrtrly chart is of interest, and especially so because of the failed rally attempt in the previous Qtr that closed near the low [2nd bar from end], but failed to have any downside follow through, and led, instead, to the small range just ended, could lead to change, but any change needs to be confirmed because price can still go lower.
The question to be asked on the silver chart, where are the sellers, goes back 9 months. On the gold chart, where have the sellers been since mid-2013 in light of all the downside manipulated selling pressure? The central bankers have exerted a vast amount of pressure on the gold market. Given the effort expended, the payback has not been that great. Yes, price declined from 1,400+ to 1,100, but look at how long the effort has taken.
We are getting yet another peek at the "Wizard" behind the curtain. [For our foreign readers, when we reference the Wizard, it comes from the Wizard of Oz where the so-called all-powerful Wizard hidden behind a curtain was a fraud, apparent to all, once the curtain was pulled back. Somewhat akin to the emperor wearing no clothes.
Because we do not predict, all we can say is the charts are telling you to be prepared for change. Once it begins, it could develop momentum that would be unstoppable.
The next Commentary will be Saturday, 11 July 2015.
By Michael Noonan
Michael Noonan, mn@edgetraderplus.com, is a Chicago-based trader with over 30 years in the business. His sole approach to analysis is derived from developing market pattern behavior, found in the form of Price, Volume, and Time, and it is generated from the best source possible, the market itself.
© 2015 Copyright Michael Noonan - All Rights Reserved Disclaimer: The above is a matter of opinion provided for general information purposes only and is not intended as investment advice. Information and analysis above are derived from sources and utilising methods believed to be reliable, but we cannot accept responsibility for any losses you may incur as a result of this analysis. Individuals should consult with their personal financial advisors.
Michael Noonan Archive |
© 2005-2022 http://www.MarketOracle.co.uk - The Market Oracle is a FREE Daily Financial Markets Analysis & Forecasting online publication.