


Stock Market NYSE A/D Line “Death Crossover”
Stock-Markets / Stock Markets 2015 Sep 21, 2015 - 08:50 AM GMT

 Last month we wrote the following:
“The chart of the % of stocks above the 200 Price Moving Average (PMA) finally shows the 100 Daily Moving Average (white line) crossing the 200 DMA (green line). This is a technical “death-cross” The only indicator not in bearish agreement is the NYSE Advance/Decline line. When this indicator shows a similar 100/200 DMA crossover, I believe it will only be a matter of time, based on historic precedent, before an “official” bear market will be declared”.
Well we did not have to wait long for the NYSE A/D line to play ball. On the 9th. of September
the death cross occurred.
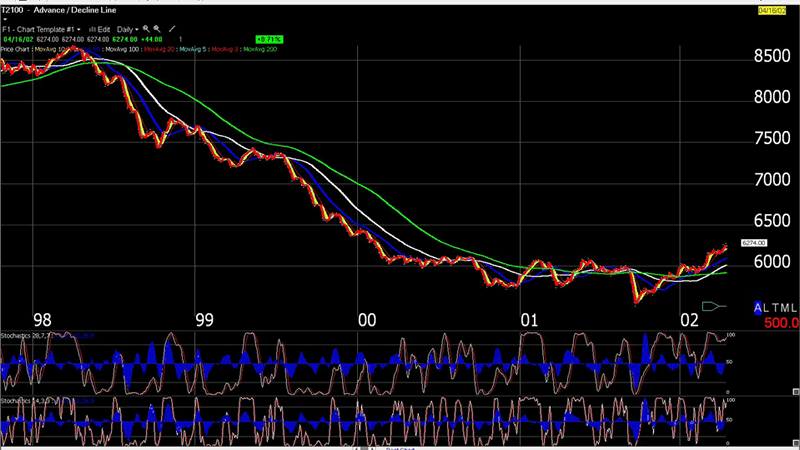
In the last two recessions the A/D line worked brilliantly fore-warning increased market risk. The charts below show that for the recession of 2000 the death cross occurred in July 1998. The contraction of 2008 was heralded by a similar cross-over in October 2007.
At this juncture it is hard to say when the next economic contraction will officially commence but I reckon it is becoming highly probable that 2016 will be a brutal year for all. This scenario, should it unfold, will have major implications for the eventual outcome of the American presidential elections. An economic contraction will favour a Republican victory I feel. Thus I would say the Clinton camp is beginning to become gravely concerned with the FED’s confused statements. The actions of Janet Yellen last week indicated that the Federal Reserve is unsure of the way forward and it is becoming increasingly clear that in the event of a slowing economy it will have no tools available to it to apply as they have all been squandered by former regimes.
Chart: NYSE A/D Line 18th. September 2015: Daily.
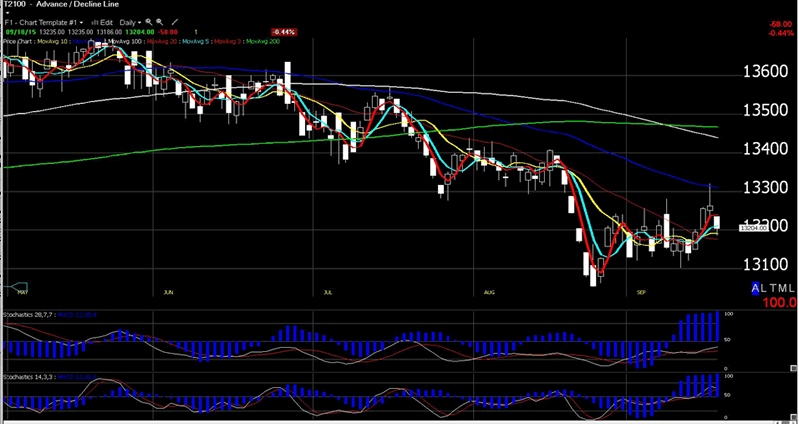
Chart: NYSE A/D Line 2007: Daily.
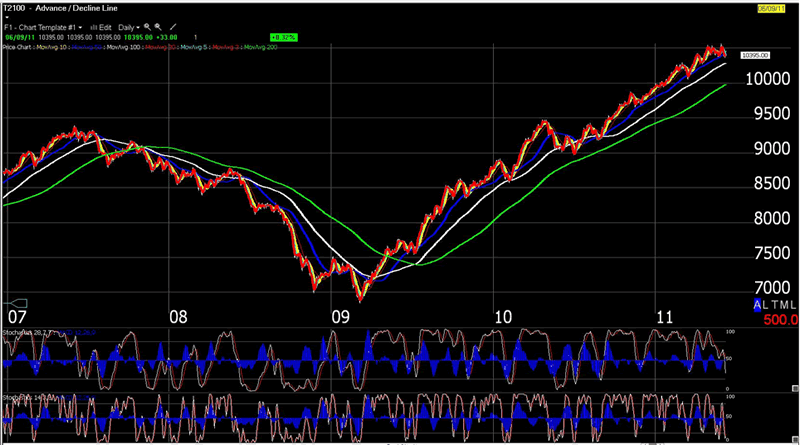
Chart: NYSE A/D Line 1998: Daily.
Charts courtesy of Worden Bros.
By Christopher M. Quigley
B.Sc., M.M.I.I. Grad., M.A.
http://www.wealthbuilder.ie
Mr. Quigley was born in 1958 in Dublin, Ireland. He holds a Bachelor Degree in Accounting and Management from Trinity College Dublin and is a graduate of the Marketing Institute of Ireland. He commenced investing in the stock market in 1989 in Belmont, California where he lived for 6 years. He has developed the Wealthbuilder investment and trading course over the last two decades as a result of research, study and experience. This system marries fundamental analysis with technical analysis and focuses on momentum, value and pension strategies.
Since 2007 Mr. Quigley has written over 80 articles which have been published on popular web sites based in California, New York, London and Dublin.
Mr. Quigley is now lives in Dublin, Ireland and Tampa Bay, Florida.
© 2015 Copyright Christopher M. Quigley - All Rights Reserved
Disclaimer: The above is a matter of opinion provided for general information purposes only and is not intended as investment advice. Information and analysis above are derived from sources and utilising methods believed to be reliable, but we cannot accept responsibility for any trading losses you may incur as a result of this analysis. Individuals should consult with their personal financial advisors before engaging in any trading activities.
Christopher M. Quigley Archive |
© 2005-2022 http://www.MarketOracle.co.uk - The Market Oracle is a FREE Daily Financial Markets Analysis & Forecasting online publication.