


Stock Market Just Formed a “Death Cross” - Should You Worry?
Stock-Markets / Stock Markets 2015 Sep 21, 2015 - 05:29 PM GMTBy: Casey_Research

 By Justin Spittler
The world economy appears to be stalling…
Yesterday, we got news that South Korea’s exports dropped 14.7% since last August...their largest decline since the financial crisis. It’s far worse than the 5.9% drop economists were expecting.
South Korea’s exports are important because they’re considered a “canary in the coalmine” for the global economy. South Korea is a major exporter to the largest economies in the world including China, the US, and Japan. South Korea also releases its export numbers much earlier than other major countries. That’s why a bad reading for South Korean exports is often the first sign that the global economy is in trouble.
The ugly news slammed stocks around the world. Chinese stocks dropped 1.3%…Japanese stocks dropped 3.8%…and the major indexes in Germany, the United Kingdom, France, and Spain all lost at least 2%.
• These big drops came one day after the worst month for global stocks in over three years…
Regular Casey readers know last month’s selloff hit every major stock market on the planet. China’s Shanghai index lost 12%...Japan’s Nikkei lost 7.4%…and Europe’s STOXX 600 lost 8.5%.
The MSCI All-Country Index, a broad measure of the global stock market, fell 6.8%...its worst month since 2012.
US stocks also fell hard. The S&P 500 lost 6.3% in August. And the Dow Jones Industrial Average fell 6.6%. It was the Dow’s worst month since May 2010, and its worst August in 17 years.
• Bearish signs are popping up everywhere…
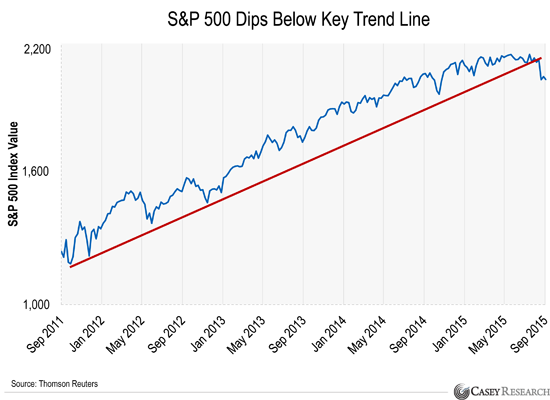
Last month’s crash dropped the S&P 500 below an important long-term trend line.
A long-term trend line shows the general direction the market is heading. Many professional traders use it to separate normal market gyrations from something bigger. Think of it as a “line in the sand.”
The market is constantly going up and down…but as long as we’re above the long-term trend line, the dominant trend is still “up.” But when a selloff knocks the stock market below its long-term trend line, it’s a sign the trend might be changing from up to down.
As you can see from the chart below, there have been a few “normal” selloffs since 2011. On Friday, however, the S&P dropped below its long-term trend line for the first time in about 4 years.
• The broken trend line isn’t the only bearish sign we see right now...
US stocks are also very expensive.
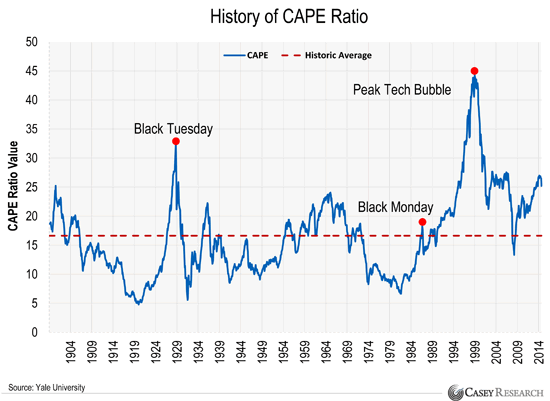
Robert Shiller is an economics professor at Yale University and a widely respected market observer. Shiller is best known for creating the CAPE (Cyclically Adjusted Price Earnings) ratio. It’s a cousin of the popular price-to-earnings (P/E) ratio.
The P/E ratio divides the price of an index or stock by its earnings-per-share (EPS) for the past year. A high ratio means stocks are expensive. A low ratio means stocks are cheap.
The CAPE ratio is the price/earnings ratio with one adjustment. Instead of using just one year of earnings, it incorporates earnings from the past 10 years. This smooths out the effects of booms and recessions and gives us a useful long-term view of a stock or market.
Right now, the S&P’s CAPE ratio is 24.6…about 48% more expensive than its average since 1881.
• US stocks have only been more expensive a handful of times…
Shiller explained why he’s worried in a recent New York Times op-ed:
The average CAPE ratio between 1881 and 2015 in the United States is 17; in July, it reached 27. Levels higher than that have occurred very few times, including the years surrounding the stock market peaks of 1929, 2000 and 2007. In all three of these instances, the stock market eventually collapsed.
For the S&P’s CAPE ratio to decline to its historical average, the S&P would have to drop to around 1,300. That would be a disastrous 34% plunge from today’s prices.
To be clear, this doesn’t mean a crash is imminent. Like any metric, the CAPE ratio isn’t perfect. CAPE is helpful for spotting long-term trends, but it can’t “time” the market.
But the high CAPE ratio is one more reason you should be extra cautious about investing in US stocks right now.
• It also means you should take steps to prepare…
As we write on Tuesday afternoon, stock markets around the world are in a free fall. The S&P 500 dropped another 3% today.
On top of that, the current bull market in US stocks is now one of the longest in history. It’s already two years longer than the average bull market since World War II.
And as we’ve explained, according to the CAPE ratio, US stocks are overpriced.
We can’t tell you for sure when the next financial crisis will hit. No one can.
But we do urge you to prepare. What’s happening right now shows how fragile the markets are. You shouldn’t ignore the mounting evidence that our financial markets just aren’t healthy.
We lay out every step you should take to prepare for the next financial crisis in our book, Going Global 2015.
This important book shows you how to get your wealth out of harm’s way and profit from the next financial disaster. It’s must-read material for anyone who’s serious about “crisis-proofing” their wealth. Right now, we’ll send it to you for practically nothing…we just ask that you pay $4.95 to cover processing costs. Click here to claim your copy.
Casey Research Archive |
© 2005-2022 http://www.MarketOracle.co.uk - The Market Oracle is a FREE Daily Financial Markets Analysis & Forecasting online publication.