Stock Market History Calling, Says Performance will be Crappy for Another ~10 years!
Stock-Markets / Stock Markets 2015 Oct 09, 2015 - 10:57 AM GMTBy: John_Mauldin
 I remember the first time I walked into Henry Blodget’s new startup, Business Insider, back in 2009. Twelve fresh-faced kids were crammed into a room about the size of my bedroom, pounding away on laptops, creating a new destination website. He took me over to a corner; we sat down in front of a few cameras; and he began shooting question after question at me, later turning the session into a series of interviews.
You walk into his office today and it’s still packed wall-to-wall with fresh-faced kids (the older I get the younger they look), but the offices are much larger, and it seemed to me last time that there had to be at least 150 people in them. But the interviews are still quick-paced, even if they’re now conducted in a special room, with upgraded equipment.
One of the things Business Insider is noted for is compelling headlines. They republish much of the work from Mauldin Economics, but they often come up with more interesting headlines for our content than we do. And they still produce a lot of original material as well.
This week’s Outside the Box is a brief note from Henry himself, with the snappy title “Market history is calling, and it’s saying stock performance will be crappy for another ~10 years.” Beyond the compelling headline is a look back at historical market performance and market cycles, with almost a dozen charts to illustrate Henry’s thesis. It’s a quick read, but investors should pay attention to his main premise: if you’re looking for returns that are north of zero, you’re going to have to be a better-than-average investor.
As an aside, I want to pass along my congratulations to Henry on the rather outsized offer (in the multiple nine figures) he has received from a German publisher for his business. I’ve always admired his determination and focus, and I enjoy watching another businessman prosper.
Now here’s a good one for you. I’m sitting in my dentist’s chair this morning, he’s checking on the laser-evisceration of my gums he performed last week, and he says, “You know, most older people have the opposite problem from you – they have too little in the way of gums, not too much. And that’s where we got the old saying ‘long in the tooth.’” So there.
It’s been a busy though uneventful week here at home; hope you’re easing into autumn, too.
Your no longer short in the tooth analyst,
John Mauldin, Editor
Outside the Boxsubscribers@mauldineconomics.com
Market history is calling, and it’s saying stock performance will be crappy for another ~10 years
By Henry Blodget
Business Insider
Stock performance has been weak for the past 15 years.
If history is a guide, it’s likely to stay weak for at least another 10 years.
Why?
Because stocks are still fantastically expensive relative to most of recorded history.
And in the past, when stocks have been this expensive – or close to this expensive – performance over the next decade has been lousy.
Long-term valuation analysis suggests that we are still working through aftermath of the highest level of stock-market valuation in history – the peak of the tech bubble in 2000 – and that this workout process will take at least another 5-10 years.
That’s the bottom line.
The Details
Over the past century, the market has gone through distinct “bull” and “bear” phases. These last, on average, 10-25 years each. Specifically:
- A 29-year bull market from 1900-1929
- A ~20-year bear market from 1930-1950
- A ~15-year bull market from 1951-1966
- A ~15 year bear market from 1967-1982
- An ~18 year bull market from 1982-2000
- A ~? year bear market from 2000-?
Some people think the latest “bear” phase ended in 2009. They also think we’re in the middle of a glorious “bull” phase again.
But based on valuation – stock prices relative to the fundamentals of the underlying companies – we unfortunately appear to still be in the middle of the latest “bear” phase.
Don’t believe it?
Let’s go to the charts.
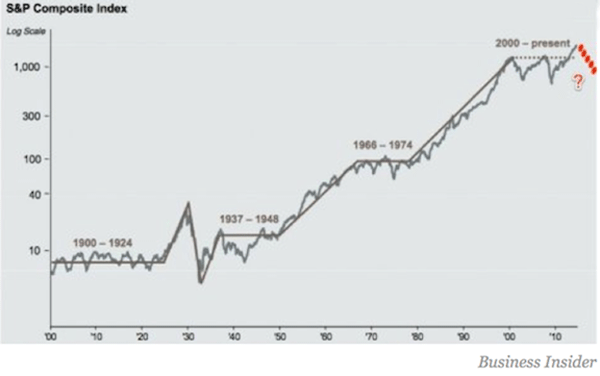
Last year, the excellent investor and commentator Barry Ritholtz published a long-term stock market chart that shows the “bull” and “bear” phase phenomenon:
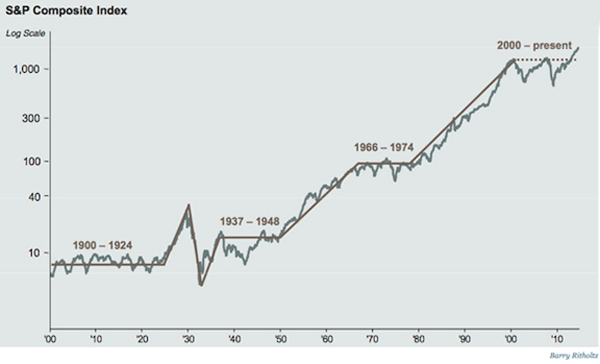
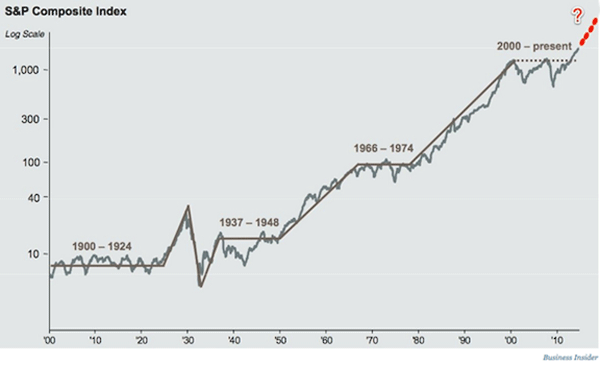
The bulls look at this chart and point out that we moved sideways for 10 years after 2000, say that was plenty, and predict that stocks will now forge ever higher for years as the new bull market continues:
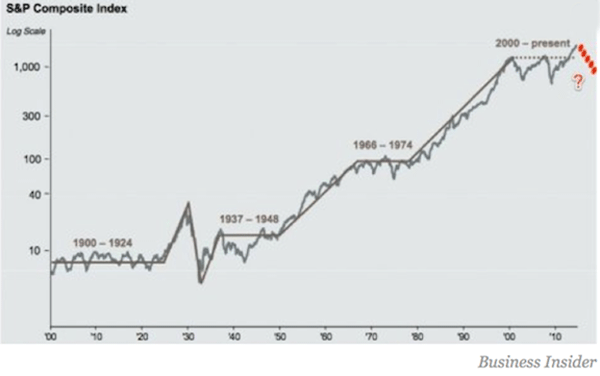
Bears, meanwhile, look at the chart and see a temporary, Fed-fueled spike in the middle of a long bear market that they believe will see at least one more big downtrend and correction (likely lasting years) before it is done:
So who’s more likely to be right?
Well, let’s add more information to that chart.
Throughout history, stock prices have loosely gravitated around the “fundamentals” of the underlying companies – namely, earnings. Specifically, stocks have traded in a range of 5X cyclically adjusted earnings (at bear-market lows) to 44X earnings (at the peak of the biggest bull market in history – the one that ended in 2000). The “average” P/E ratio over this period, meanwhile, has been about 15X.
When you add P/E ratios to the charts above, you quickly notice a pattern:
Sustained bear-market periods have begun when the P/E is very high (~25X+).
Sustained bull-market periods, meanwhile, have begun when the P/E is very low (5X to 9X).
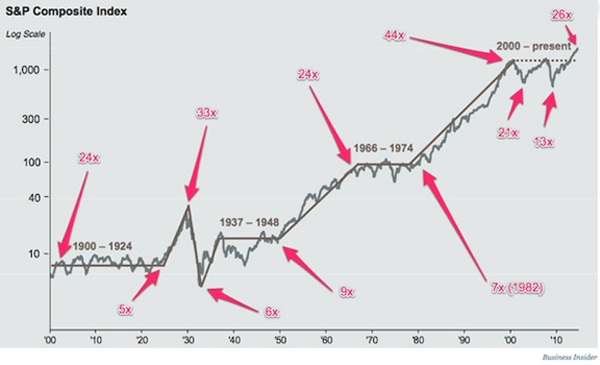
In other words, sustained bull markets begin when investors are so disgusted by stocks – and so pessimistic about the future of stocks – that they’ll pay only 5X to 9X earnings for them. And sustained bear markets begin when investors are so giddy with excitement about stocks and the prospects for stocks that they’ll happily pay 25X earnings or more for them.
So how about the recent “bear” period?
Well, it began as history suggested it would: With a stratospheric P/E ratio (44X) and widespread investor jubilation, and excitement. Back in 2000, investors were wild about stocks and the prospects for stocks, and most people (including, sadly, me) believed that stocks would keep going up.
Then, after a crash (2000 to 2002) and one failed recovery (2003 to 2007), stocks hit a crushing low in 2009 that was down more than 50% from the 2000 peak. At that moment, March 2009, many investors were scared to death of owning stocks, and many analysts expected the market to drop much farther. At that moment, the PE ratio also hit 13X. This was a below-average P/E, finally, but it was also considerably higher than the P/E ratios that had marked previous bear-market bottoms.
Then, for six years, stocks rocketed straight upward, until the market had nearly tripled off the 2009 low. Over this period, investors overcame their fear and gradually fell in love with stocks again.
As recently as six months ago, with the market setting new highs, investors were once again very excited about the future of stock prices. So excited, in fact, that they were willing to pay 26X earnings for them. But now the market is wobbling again.
And here are two more charts for you. They’re from portfolio manager John Hussman of the Hussman Funds.
First, Hussman’s analysis suggests that, on average, it takes the market about 12 years to work off extreme over- or undervaluation and get back to “normal.” In other words, it takes valuations about a dozen years to mean-revert.
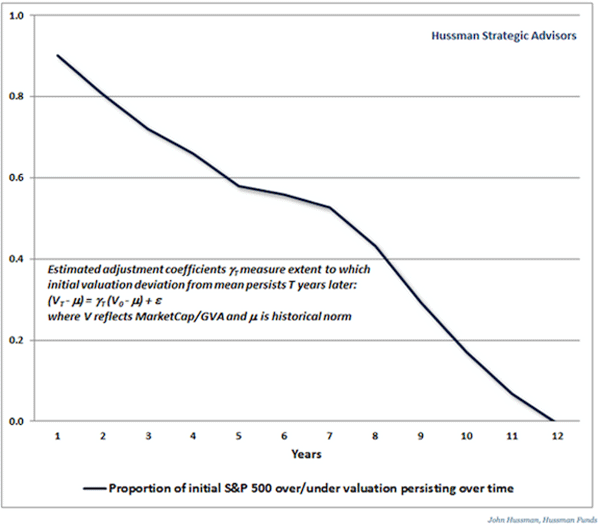
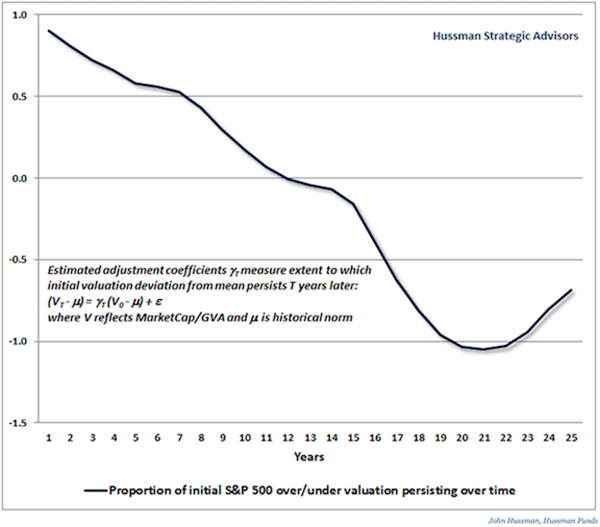
Further, Hussman’s analysis suggests that, once we have gotten back to “normal,” valuations usually continue “reverting” for many more years, until they hit the opposite extreme. This process takes, on average, about another decade.
Putting the two together, Hussman has found that the market generally takes about ~20 years to “mean-invert” – to go from one valuation extreme to the other. That’s exactly the pattern we see in the long-term charts above.
So, what does all this tell us?
Nothing conclusive, unfortunately. No one knows the future.
But let’s make a couple of observations about our current situation:
- First, even after the recent market wobble, stocks are still more expensive than they have been at any time in the past century with the exception of 2000 and 1929. And we know what happened after those years. For the “new bull market” to continue indefinitely, the market’s P/E would have to continue to keep rising toward the P/E at the historic 2000 market peak – which, it is worth noting, was followed by a devastating crash.
- Second, if we are indeed in the middle of a new bull market, the bear-market “workout period” following the 2000 peak would have been one of the shortest in history. And we were starting from the highest valuation in history, by a mile.
Unless something has changed that makes the past 115 years of market history irrelevant (always possible, but probably not likely), it would not be surprising if the biggest bull-market peak in market history was followed by one of the biggest bear-market workouts in history – one that, perhaps, might last as long or longer than any major workout period to date.
As a long-term investor, I thankfully don’t have to make short-term market calls. I have also learned (the hard and expensive way) to limit my stock exposure enough so as not to get freaked out by crashes. I own stocks, so if we’re in the middle of a new bull market, great. I also own cash and bonds, so if we’re still in the middle of a long bear market, fine. If stocks tank from here, I’ll trade some of that cash for stocks and hope that the world doesn’t end.
But my guess, for what it’s worth, is that we’re still in the middle of a long bear market. If you made me draw what I think is the most likely future for stock prices, therefore, I would draw it like this:
Like Outside the Box?
Sign up today and get each new issue delivered free to your inbox.
It's your opportunity to get the news John Mauldin thinks matters most to your finances.
John Mauldin Archive |
© 2005-2022 http://www.MarketOracle.co.uk - The Market Oracle is a FREE Daily Financial Markets Analysis & Forecasting online publication.


