


Stock Market Aggressive Sell Signals in Place
Stock-Markets / Stock Markets 2015 Oct 14, 2015 - 06:16 AM GMT

 SPX has finally reversed beneath its trendline. This morning was a false break, due to a small Megaphone formation that resulted in a new high. It is now on an aggressive sell signal.
I re-calibrated the Primary Cycle Pivot dates and, although there was a PC Pivot on 10-6, the turn was made today, 4.3 market days later. In fact, the Cycle Top happened on a PI Hour (67.5, which is divisible by 3.1416 and 4.3). This would be expected from a rally that has a Megaphone ending and a Wave (B). Wave B of any degree may be a rogue wave in outliving its expectations. Investors are still bullish, despite only exceeding Wave (A) by only 1.52 points. In Elliott Wave parlance, this is a flat correction, due to the flat top.
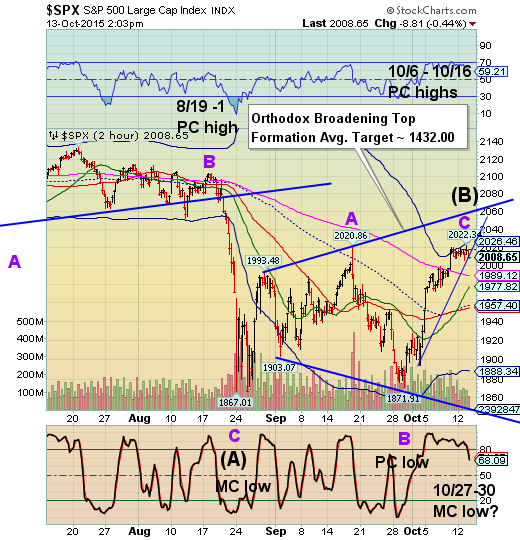
Today is also day 253 in the Master Cycle. All other Cycles invert, except Master Cycles, the Primary Cycle being the chief offender. In this case, this is a Primary Cycle inversion that is 3 days early (21.5 hours).
I updated the probable dates for the new Master Cycle low, October 23 is possible, but may not be a fit, since I am using the VIX as a guide for the now overdue SPX Master Cycle low. .
The VIX has finally broken above both the Cycle Bottom at 16.17 and an Ending Diagonal trendline. There was a combination Primary Cycle low and Master Cycle low due on 10/7. Today is 4.3 market days later and we finally got the low. It is now on an aggressive buy signal.
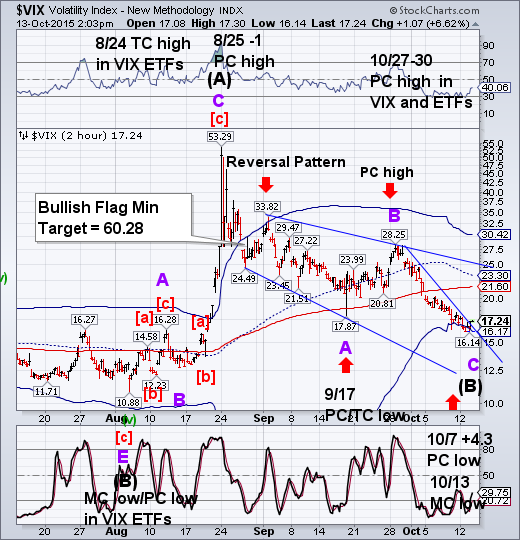
You may recall that, last month I had suggested there would be no more Master Cycle lows in VIX until December. I was wrong. Master Cycle lows generally need at least 43 days of separation and, on average, may occur between 60 and 86 days apart. The most recent example was the belated August 5 low, which came in 75 days after the last Master Cycle low.
The latest exception in SPX occurred on May 6, and was 93 days from the last MC low. Low volatility may have been the cause of both late Cycle lows. Higher Volatility appears to cause shorter SPX Cycles. In this case, rising Volatility may have caused the 8/24 low in SPX, which was 8.6 days early. There is no other explanation that comes to mind.
I have arranged the chart Trading Band structure to correspond with Master cycle lows, or their close proximity. You can see the last Master Cycle low in VIX was on August 5. Today is day 69 from that point. I found a Master cycle low (January 22) that I had not previously observed, but not labeled. It occurred 49 days after the prior MC low and 56 days from the next MC low. October 7 would have been its normal due date, but today is 4.3 market days later.
This now closes a gap that I had in my analysis.
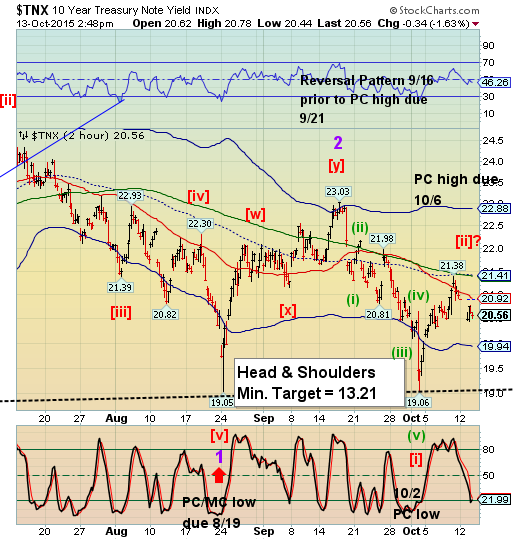
TNX is also becoming overdue for its next Master Cycle low, which is normally due on October 15. I cannot imagine TNX declining below its Head & Shoulders trendline in 2 days. However, given its start, it may make up for lost time. I suspect that TNX may decline through the last week of October, as well as SPX, but don’t expect them to go exactly hand-in-hand. TNX is on a confirmed sell signal.
Regards
Tony
Our Investment Advisor Registration is on the Web
We are in the process of updating our website at www.thepracticalinvestor.com to have more information on our services. Log on and click on Advisor Registration to get more details.
If you are a client or wish to become one, please make an appointment to discuss our investment strategies by calling Connie or Tony at (517) 699-1554, ext 10 or 11. Or e-mail us at tpi@thepracticalinvestor.com .
Anthony M. Cherniawski, President and CIO http://www.thepracticalinvestor.com
As a State Registered Investment Advisor, The Practical Investor (TPI) manages private client investment portfolios using a proprietary investment strategy created by Chief Investment Officer Tony Cherniawski. Throughout 2000-01, when many investors felt the pain of double digit market losses, TPI successfully navigated the choppy investment waters, creating a profit for our private investment clients. With a focus on preserving assets and capitalizing on opportunities, TPI clients benefited greatly from the TPI strategies, allowing them to stay on track with their life goals
Disclaimer: The content in this article is written for educational and informational purposes only. There is no offer or recommendation to buy or sell any security and no information contained here should be interpreted or construed as investment advice. Do you own due diligence as the information in this article is the opinion of Anthony M. Cherniawski and subject to change without notice.
Anthony M. Cherniawski Archive |
© 2005-2022 http://www.MarketOracle.co.uk - The Market Oracle is a FREE Daily Financial Markets Analysis & Forecasting online publication.