


BEA Revises U.S. 4th Quarter 2015 GDP Growth Upward to 1.00%
Economics / US Economy Feb 26, 2016 - 05:34 PM GMTBy: CMI

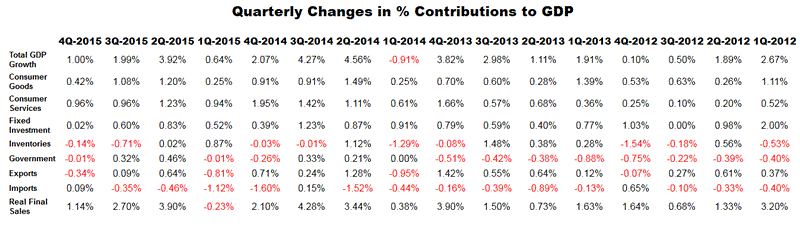
 In their second estimate of the US GDP for the fourth quarter of 2015, the Bureau of Economic Analysis (BEA) reported that the economy was growing at a +1.00% annualized rate, up +0.31% from their first estimate for the fourth quarter, but still down -0.99% (nearly half) from the third quarter.
All of the net improvement can be attributed to one line item, inventories -- which were up the same +0.31% as the headline aggregate -- while the sum of the changes in the other line items netted out to zero.
Economic growth provided by consumer spending was revised downward still further, with the contribution to the headline growth from spending on consumer goods dropping -0.11%. Fixed investment growth (already essentially nil) dropped another -0.01% to +0.02%. Governmental spending entered mild contraction, removing -0.01% from the headline. Exports weakened yet again, clipping -0.34% from the headline.
In fact, other than inventories, the only good news was that (using the BEA's logic and arithmetic) lower spending on imports contributed +0.09% to the headline growth number. Although most of this lower spending came from falling commodity prices, some also came from weaker demand.
As we have mentioned a number of times before, the BEA's treatment of inventories can introduce noise and seriously distort the headline number over short terms -- which the BEA admits by also publishing a secondary headline that excludes the impact of inventories. Because the upward inventory blip equaled the entire improvement in the headline number, the BEA "bottom line" (their "Real Final Sales of Domestic Product") was unchanged in this revision -- and was still less than half of what was reported for the prior quarter.
Annualized household disposable income was revised downward in this report. Real annualized per capita disposable income was reported to be $38,320 per annum, down $125 from the previous estimate -- although up $155 from a downward revised prior quarter. The household savings rate dropped to 5.1% -- down -0.3% from the previous estimate but up +0.1% from the revised prior quarter.
For this revision the BEA assumed an annualized deflator of 0.96%. During the same quarter (October 2015 through December 2015) the inflation recorded by the Bureau of Labor Statistics (BLS) in their CPI-U index was revised to a very similar 0.93%. Slightly over estimating inflation results in slightly pessimistic growth rates, and if the BEA's "nominal" data was deflated using CPI-U inflation information the headline growth number would be a marginally better +1.03%.
Among the notable items in the report :
-- The headline contribution from consumer expenditures for goods was cut to +0.42% (down -0.11% from the earlier estimate and -0.66% -- more than halved -- from the previous quarter).
-- The contribution to the headline from consumer services improved slightly to +0.96% (up +0.03% from the previous report and flat relative to the third quarter). The combined consumer contribution to the headline number was +1.38%, down -0.46% (about one-fourth) from 3Q-2015.
-- The headline contribution from commercial private fixed investments was a negligible +0.02%, down -0.58% from the prior quarter.
-- Although the contribution from inventories remained negative -- subtracting -0.14% from the headline number -- this was an improvement of +0.31% from the previous estimate. This was also an improvement of +0.57% from the -0.71% recorded in 3Q-2015. Since this one line item contributes the entire headline gain, it bears repeating that the BEA's inventory numbers are exceptionally noisy, subject to significant distortions/anomalies caused by commodity price swings and represent a zero reverting (and long term zero sum) series.
-- Governmental spending slipped into a slight contraction, removing -0.01% from the headline (down -0.13% from the first estimate and -0.33% from the prior quarter). The reported contraction came exclusively from state and local spending on infrastructure.
-- The contribution to the headline number from exports remained in contraction at -0.34% (down -0.03% from the previous estimate and down -0.43% from the prior quarter). This contraction is likely to continue until either the dollar or global economic growth reverse direction.
-- As the dollar strengthened and commodity prices weakened, imports actually generated +0.09% growth in the BEA's model of the economy, up some +0.25% from the previous report and up +0.44% from the prior quarter. This is not exclusively about dollar growth and global oil gluts -- weakening domestic demand is also contributing to this "improvement."
-- The "real final sales of domestic product" is unchanged from the previous estimate, reported to be growing at a +1.14% annualized rate, down substantially (more than halved) from the +2.70% in the prior quarter. This is the BEA's "bottom line" measurement of the economy and it excludes the reported inventory contraction.
-- Also as mentioned above, real per-capita annual disposable income was revised downward by $125 in this report, while the household savings rate declined in concert with the softening incomes. It is important to keep this line item in perspective. Real per-capita annual disposable income is up only +4.48% in aggregate since the second quarter of 2008 -- a meager annualized +0.59% growth rate over the past 30 quarters. Meanwhile, according to Sentier Research, median incomes during the same time span have contracted by roughly 4%.
The Numbers, As Revised
As a quick reminder, the classic definition of the GDP can be summarized with the following equation :
or, as it is commonly expressed in algebraic shorthand :
In the new report the values for that equation (total dollars, percentage of the total GDP, and contribution to the final percentage growth number) are as follows :
GDP Components Table
| Total GDP | = | C | + | I | + | G | + | (X-M) | |
|---|---|---|---|---|---|---|---|---|---|
| Annual $ (trillions) | $18.1 | = | $12.4 | + | $3.0 | + | $3.2 | + | $-0.5 |
| % of GDP | 100.0% | = | 68.5% | + | 16.7% | + | 17.7% | + | -2.9% |
| Contribution to GDP Growth % | 1.00% | = | 1.38% | + | -0.12% | + | -0.01% | + | -0.25% |
Summary and Commentary
This report is mostly statistical noise, although some enduring patterns can be seen :
-- The reported growth came largely from inventories and imports, both of which can be held hostage by rapidly changing commodity prices. The reported changes are greatly amplified by significant monetary revaluations to mostly smaller changes in the physical levels of trade and inventories.
-- Consumer demand for goods was revised downward, as was fixed investment -- by states, local governments and commercial investors. Any lingering growth in the consumer, commercial and governmental demand for real/physical goods is softening.
-- Exports fell even further into contraction.
-- Any residual growth in consumer spending for services is not discretionary -- it is primarily a consequence of inexorably rising health care costs.
-- Mean household real disposable incomes are not growing significantly -- and median household real incomes are still down 4% relative to 2008.
-- On the flip side of household ledgers, monies that are no longer being spent at the gasoline pump are mostly being saved. The savings rate is an indication that households are not particularly confident when looking forward. And -- given stagnant incomes, international headlines and domestic political "fear, uncertainty and doubt" (FUD) -- that confidence is not likely to improve over the next several quarters.
Even at face value, a 1% growth rate is fundamentally anemic. And looking deeper into the numbers, most of that 1% comes from the economic fog created by highly volatile commodity prices. So, despite an upward blip in the headline number, we see no particular reason to be cheering this report.
Consumer Metrics InstituteTM
Home of Daily Consumer Leading Indicators
http://www.consumerindexes.com
© 2016 Copyright Consumer Metrics Institute - All Rights Reserved Disclaimer: The above is a matter of opinion provided for general information purposes only and is not intended as investment advice. Information and analysis above are derived from sources and utilising methods believed to be reliable, but we cannot accept responsibility for any losses you may incur as a result of this analysis. Individuals should consult with their personal financial advisors.
© 2005-2022 http://www.MarketOracle.co.uk - The Market Oracle is a FREE Daily Financial Markets Analysis & Forecasting online publication.