


Massive Silver Price Rally During The Coming US Dollar Collapse
Commodities / Gold and Silver 2016 May 18, 2016 - 03:15 PM GMTBy: Hubert_Moolman

 I have written extensively about how the current silver bull market is similar to the 70s. Despite these similarities, silver will (ultimately) perform much better than during the 70s.
The fractal analysis of the US Dollar Index (below) shows some more similarities and differences between the 70s era and now. I believe that these further supports the expectation that silver will perform much better than it did during the 70s.
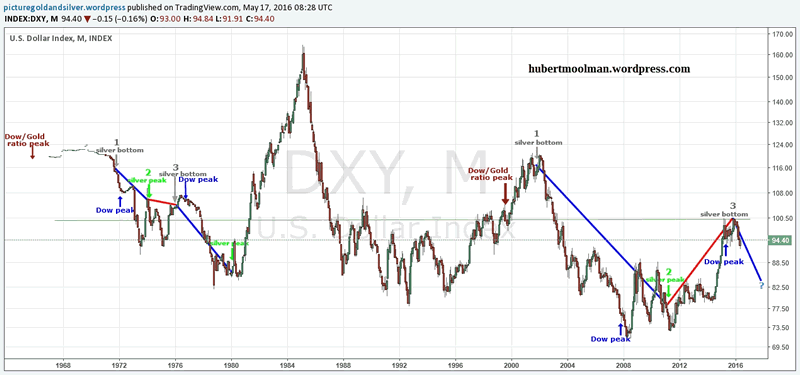
On the chart, I have marked two fractals (1 to 3). Both fractals exist in similar conditions - relative to the relevant Dow/Gold ratio peaks (1966 and 1999). Both fractals span over the period of the first phase of the silver bull market during the 70s and the current era (2001 to 2016), respectively.
If the comparison is justified, then the US Dollar index will fall significantly during the coming months. Given the fact that silver has traditionally had its strong rallies during times when the US Dollar Index was falling, this bodes well for a silver rally. Note that this does not mean silver only rallies when the US Dollar Index goes down.
One of the differences between the two patterns is the fact that from point 2 to 3 (the period when silver made a correction from its peak), the US Dollar Index actually moved down on the 70s pattern, whereas it was moving up on the current pattern. This is probably why the correction for silver was much deeper since the April 2011 peak ($50 to about $14) as compared to the silver correction since the February 1974 peak ($6.7 to $3.8).
The silver bottom of the 70s pattern (point 3 - Jan 1976) came in while the US Dollar Index was still in an upward move. This would have been an obstacle to a quick rise of the silver price (indeed, silver was still stuck in a consolidation long after the silver bottom.
On the current pattern the silver bottom (point 3 - December 2015) came in at exactly the peak of the US Dollar index (December 2015). This means that the first part of the current silver rally has much less resistance from US Dollar strength as compared with the 70s rally. This is likely to continue provided that the December 2015 US Dollar Index top is actually the peak.
The silver bottom of the 70s pattern (point 3 - Jan 1976) came in before the Dow peak (September 1976). This means that the Dow was still rising, which is also an obstacle to a quick rise of the silver price. This would have contributed to silver being so slow to get out of the starting blocks after the January 1976 bottom.
On the current pattern the silver bottom (point 3 - December 2015) came in after the Dow peak (May 2015). This is ideal, given the fact that silver and the Dow move in opposite directions (I have written about this extensively). Again, this means that the current silver rally since December 2015 has much less resistance (from Dow strength) as compared with the 70s. This will continue, with silver rising even faster when the Dow goes into its next leg down (which could be brutal).
During the 70s, when the US Dollar index went from point 3 (January 1976) to January 1980 (some time after its bottom), silver actually went from about $3.80 to $50. If the current pattern on the US Dollar Index plays out as expected, and silver has a similar rally to that of the 70s, then silver could go to $184. Given that the expectation is for silver to outperform the 70s rally, it is likely to exceed the $184 level.
One difference that this chart does not necessarily show is the strong likelihood that the coming US Dollar collapse will not be like the previous ones, since this will bring the collapse of the monetary system (again, I have written about this extensively). This will guarantee a sudden and quick rise of silver (in any measurement), to the extent that the US Dollar price of silver will not matter.
Warm regards,
For more of this kind of analysis on silver and gold, you are welcome to subscribe to my premium service. I have also recently completed a Long-term Silver Fractal Analysis Report .
Warm regards
Hubert
“And it shall come to pass, that whosoever shall call on the name of the Lord shall be saved”
http://hubertmoolman.wordpress.com/
You can email any comments to hubert@hgmandassociates.co.za
© 2016 Copyright Hubert Moolman - All Rights Reserved
Disclaimer: The above is a matter of opinion provided for general information purposes only and is not intended as investment advice. Information and analysis above are derived from sources and utilising methods believed to be reliable, but we cannot accept responsibility for any losses you may incur as a result of this analysis. Individuals should consult with their personal financial advisors.
© 2005-2022 http://www.MarketOracle.co.uk - The Market Oracle is a FREE Daily Financial Markets Analysis & Forecasting online publication.