


Stock Market Retrograde Uranus
Stock-Markets / Stock Markets 2016 Aug 10, 2016 - 12:58 PM GMTBy: Brad_Gudgeon

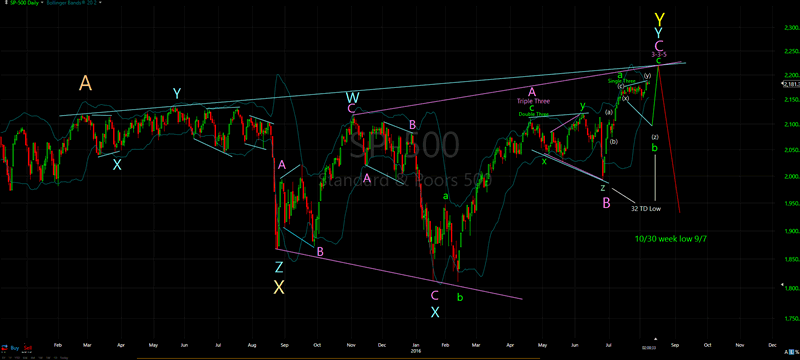
The chart below shows an alternative wave count to the one I proposed earlier this week. At this juncture (8/9/16), we have made a new high at 2187. The daily Stochastics is not confirming this new high, and the top looks irregular along with a tight Bollinger Band. In the past, the market may have pulled back nearly 10% from one of these tops and taken several weeks to do so. But, we have Uranus Retrograde and we may expect the unexpected, especially since the moon conjuncts Saturn and Mars over the next few days in the exaggerated sign of Sagittarius as we get closer to Saturn "Stationary Direct" (lows are often made while the moon is in Sagittarius).
The alternative scenario has the SPX dropping suddenly into the 32 TD low due on August 11 to as low as the 2089, 50% retracement area of the move from the June 27th 20-week low (wave 'b' of "c"), and then rallying one more rally into August 17th to near 2219/20 (wave 'c' of "c") forming a 66 week cycle top from the May 20th, 2015 high. This scenario would mirror 32 TD's ago (June 23-27), but not as deep, as the degree wave is not the same.
Normally, wave 'b' would go back into the shadow of the previous wave "b" and that is between 2074 and 2109. IF the SPX hits the top of the rising trends tops next week, then that should be the high of the year and the market would then tumble down into a Wave A of Z low (Wave C being November) somewhere around September 7 where the perfect 10 week, 50 TD low is located (June 2nd is within reach also at 48 TD's -2 TD's).
IF the SPX fails to get down through 2147/48 this week, all bets are off for any higher upside targets for the month, the earlier scenario would likely see the SPX taking out the June 27 low by September 2.
SPX Daily Chart
The market is like playing a chess grand master, you have to figure out what the possible moves are and position yourself accordingly.
Brad Gudgeon
Editor of The BluStar Market Timer
The BluStar Market Timer was rated #1 in the world by Timer Trac in 2014, competing with over 1600 market timers. This occurred despite what the author considered a very difficult year for him. Brad Gudgeon, editor and author of the BluStar Market Timer, is a market veteran of over 30 years. The website is www.blustarmarkettimer.info To view the details more clearly, you may visit our free chart look at www.blustarcharts.weebly.com.
Copyright 2016, BluStar Market Timer. All rights reserved.
Disclaimer: The above information is not intended as investment advice. Market timers can and do make mistakes. The above analysis is believed to be reliable, but we cannot be responsible for losses should they occur as a result of using this information. This article is intended for educational purposes only. Past performance is never a guarantee of future performance.
Brad Gudgeon Archive |
© 2005-2022 http://www.MarketOracle.co.uk - The Market Oracle is a FREE Daily Financial Markets Analysis & Forecasting online publication.