


The Gold To Housing Ratio As A Valuation Indicator
Commodities / Gold and Silver 2016 Sep 14, 2016 - 03:21 AM GMTBy: Dan_Amerman

 The Gold to Housing ratio is a quite useful measure for evaluating relative values between real estate and gold, and also has an interesting historical track record for identifying turning points in long-term gold price trends. In light of the surge in gold prices in 2016, and the continuing strength in housing – it is worthwhile revisiting this basic measure, because the results aren't at all what most people likely think they are.
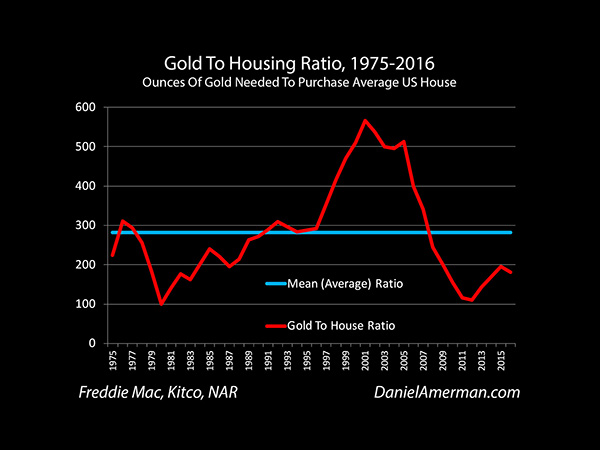
The Gold to Housing ratio is a measure of relative value between gold and real estate. It is the number of ounces of gold required to purchase an average single family home in the United States.
Now people often buy gold and real estate as alternative investments, either because they are seeking fundamental diversification from financial assets such as stocks and bonds, or they are concerned about inflation.
However, while real estate and gold are each tangible assets and can be powerful inflation hedges – they don't tend to move together in real terms.
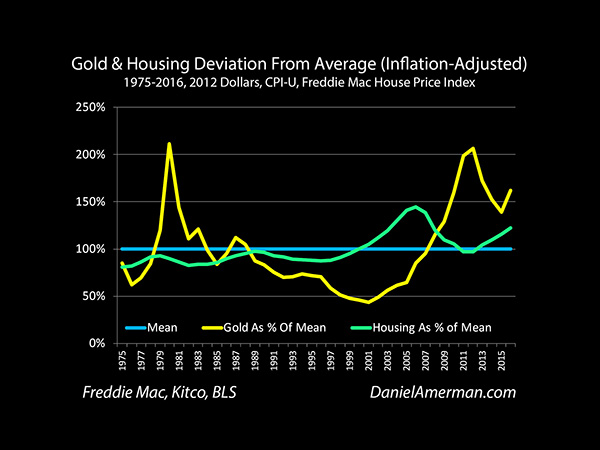
This can be clearly seen when we adjust historical prices for inflation, as shown above. Both investments do oscillate up and down around long term averages over the 40+ years, but they so in quite different cycles, with their peaks and valleys occurring in different years.
When we take the $243,301 current median national price for an existing single family home and divide it by the $1,350 price per ounce of gold as of August 18, 2016, we come up with a Gold to Housing ratio of 180, meaning it takes 180 ounces of gold to purchase an average single family home (detailed methodology notes are available here).
Key Current Analysis Results
Below is a quick summary of 15 key points about the Gold to Housing ratio in 2016. I have been writing about these subjects for some years now, and for long-time readers I specifically point to the investment implications within that much larger body of work. The great majority of the information should still be clearly understandable for a first time or recent reader.
I have been writing about these subjects for some years now, and for long-time readers I specifically point to the investment implications within that body of work. The great majority of the information should still be clearly understandable for a first time or recent reader.
1) Gold and housing are each above their long term averages in inflation-adjusted terms, with gold being much higher relative to its average valuation than we see with housing.
2) Both gold and housing have risen sharply in price in 2016 - but the increase in gold prices is much greater, on a percentage basis.
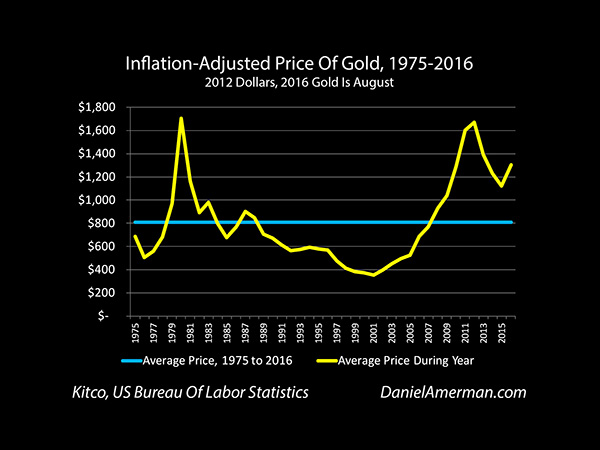
3) Gold is not acting as a "stable store of value", because that is a myth in modern times. Instead gold has been acting as something much rarer and more desirable - which is as a contra-cyclical crisis hedge. This can be clearly seen with the two spikes in value that correspond to crisis and perception of crisis, and led to gold valuations in inflation-adjusted terms that were more than four times as high as the lowest annual average. However, this can be problematic for buy and hold strategies at current price levels, when people think they are buying a stable store of value, particularly when inflation taxes are taken into account.
4) As an inflation hedge, and as explored in the "Crisis Strategy" as well as "Gold Out Of The Box", gold is behaving exactly as expected, and experiencing asset inflation in inflation-adjusted terms as market expectations of crisis are rising, which unlocks far more upside potential than would exist if gold were a mere stable store of value. If full blown crisis does develop, then gold still has substantial upside potential, even with its high current valuation by historical standards. Indeed, in nominal terms (non inflation-adjusted) there is still room for a spectacular upside for gold in the event of monetary crisis.
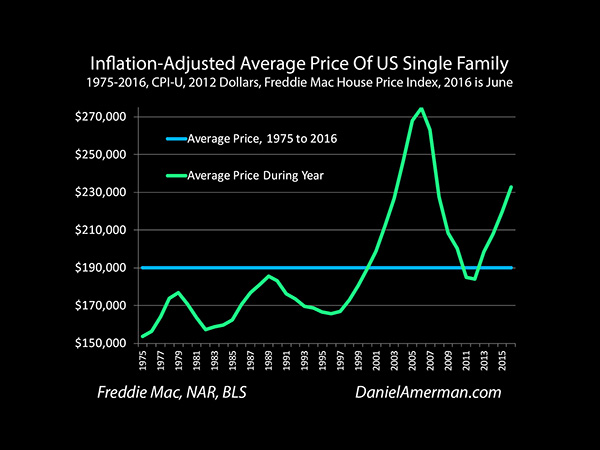
5) Real estate is not at a peak when inflation is taken into account, but on a national basis, U.S. single family home prices are at the highest levels they have ever been outside of the bubble of the 2000s.
6) In the event of crisis, real estate is quite overvalued, and would likely experience substantial deflation in inflation-adjusted terms as explored in the "Crisis Strategy", even though the nominal prices of single family homes may set new records.
7) In the event of crisis and over the short term, gold should strongly outperform housing. However, from a long term perspective - gold is highly overvalued relative to real estate. A return to the long-term average of the Gold to Housing ratio of 282 from the current level of 180 would mean that housing would rise in value relative to gold by about 57%. This could occur by housing increasing in value faster than gold does, or by gold falling in value, or by gold falling in value faster than housing does. What the ratio measures is relative valuation.
8) If there is no crisis, then gold should experience steep losses over time in inflation-adjusted terms. In this case. gold may drop below well below its long-term average inflation-adjusted valuation, much like it did for almost the entire period between 1984 and 1997.

9) Quartile analysis is a useful tool for examining the current Gold to Housing ratio of 180. The top quarter (approximate) is that there are ten years in which the Gold to Housing ratio was between 196% and 314% of the 180 we are currently seeing. In other words, roughly 25% of the time, houses were worth between two and three times as much relative to gold, than what we are currently seeing.
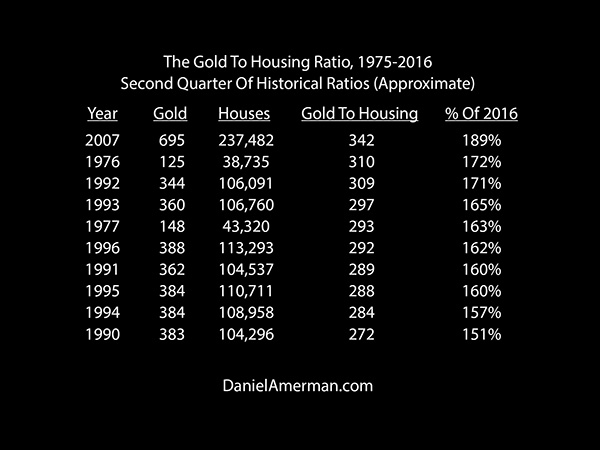
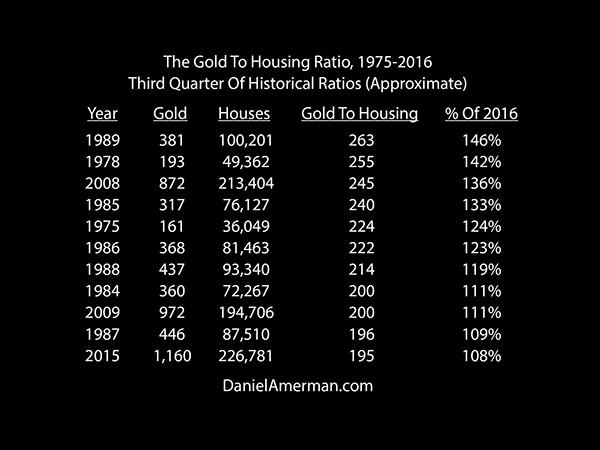
10) There are two quarters (or about 50% of the instances) where housing had a value (relative to gold) in an amount between 108% and 189% of the current ratio. So roughly speaking, about half of the time houses are worth somewhere between a little more and almost twice as much as they are right now, relative to gold.
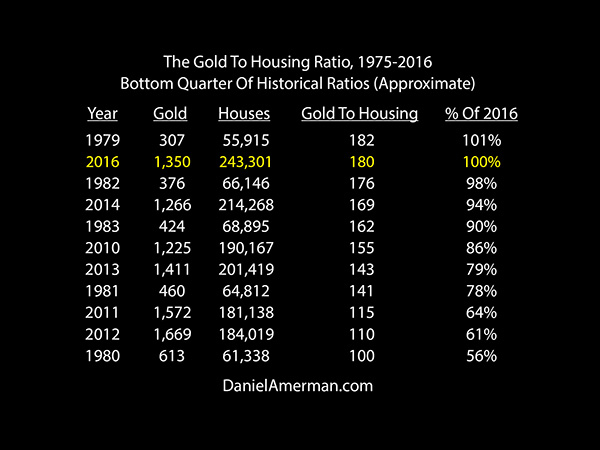
11) In the 41 years prior to 2016, from 1975-2015 (inclusive), there were only nine years where the average Gold to Housing ratio was lower than the 180 we are currently seeing.
So, in very approximate and rounded terms and based on the preceding 41 years, about 25% of the time gold would be expected to increase in value relative to housing, roughly 50% of the time housing would gain between 0% and 100% relative to gold, and roughly 25% of the time housing would double or more in value relative to gold.
12) The quarters are far from random, but are tightly correlated with crisis and the expectations of crisis - or the lack thereof. All of the bottom quarter, where gold is richly priced relative to housing, are years close to crisis, or years where there were widespread expectations of crisis.
13) Without exception, as we get away from the years immediately surrounding crisis and widespread expectations of crisis, housing has a higher valuation relative to gold than what we are seeing today. The future may travel a different path than the past, but what history seems to indicate is that whether a crisis occurs or not, it is highly likely over the long term that housing will outperform gold, so long we eventually return to post crisis pricing for both tangible asset classes.
14) If there is no crisis, and if liabilities are used with real estate, then such alternative strategies as the "Prosperity Strategy" or the "Stagnation Strategy" may outperform gold by many times over.
15) Blended strategies such as the "Crisis Strategy" or the "Robust Strategy" would likely strongly outperform a pure precious metals strategy if there is no crisis, while still being positioned to profit from crisis if that does turn out to be what happens.
If there is a monetary crisis, and if a liability has been used as part of an asset/liability management strategy, then over the long term and after the crisis has receded, income properties on a national average should outperform gold by much more than 57%, and perhaps a multiple thereof. This is only true, however, if the strategy can survive a crisis environment that would likely destroy many traditional real estate leverage strategies.
This is an update, and while complete on its own, is also based on a much larger body of work. A detailed historical analysis of the Gold to Housing Ratio which provides a deeper background understanding, and analyzes turning point years such as 1980, 2001 and 2012 for the price relationships between gold and housing, is linked here. More information on the strategies referenced is available here.
Daniel R. Amerman, CFA
Website: http://danielamerman.com/
E-mail: mail@the-great-retirement-experiment.com
Daniel R. Amerman, Chartered Financial Analyst with MBA and BSBA degrees in finance, is a former investment banker who developed sophisticated new financial products for institutional investors (in the 1980s), and was the author of McGraw-Hill's lead reference book on mortgage derivatives in the mid-1990s. An outspoken critic of the conventional wisdom about long-term investing and retirement planning, Mr. Amerman has spent more than a decade creating a radically different set of individual investor solutions designed to prosper in an environment of economic turmoil, broken government promises, repressive government taxation and collapsing conventional retirement portfolios
© 2016 Copyright Dan Amerman - All Rights Reserved
Disclaimer: This article contains the ideas and opinions of the author. It is a conceptual exploration of financial and general economic principles. As with any financial discussion of the future, there cannot be any absolute certainty. What this article does not contain is specific investment, legal, tax or any other form of professional advice. If specific advice is needed, it should be sought from an appropriate professional. Any liability, responsibility or warranty for the results of the application of principles contained in the article, website, readings, videos, DVDs, books and related materials, either directly or indirectly, are expressly disclaimed by the author.
© 2005-2022 http://www.MarketOracle.co.uk - The Market Oracle is a FREE Daily Financial Markets Analysis & Forecasting online publication.