


US Jobs Decline for 7th Month, Deep Revisions to Bad Data
Economics / US Economy Aug 01, 2008 - 11:02 AM GMTBy: Mike_Shedlock

 Before taking a look at the monthly jobs data, let's take a look at weekly claims. The US Department of Labor is reporting Initial Unemployment Insurance Claims continue to rise.
Seasonally Adjusted
In the week ending July 26, the advance figure for seasonally adjusted initial claims was 448,000, an increase of 44,000 from the previous week's revised figure of 404,000. The 4-week moving average was 393,000, an increase of 11,000 from the previous week's revised average of 382,000.
Unadjusted
The advance number of actual initial claims under state programs, unadjusted, totaled 375,627 in the week ending July 26, a decrease of 36,898 from the previous week. There were 257,426 initial claims in the comparable week in 2007.
Jobs Decline 6th Consecutive Months
This morning, the Bureau of Labor Statistics (BLS) released the July Employment Report . Jobs were negative for a 7th consecutive month. My target of 6% or higher stated unemployment by the end of the year remains on track. Here is a synopsis of that report.
The unemployment rate rose to 5.7 percent, and nonfarm payroll employment continued to trend down in July (-51,000), the Bureau of Labor Statistics of the U.S. Department of Labor reported today. Employment continued to fall in construction, manufacturing, and several service-providing industries, while health care and mining continued to add jobs. Average hourly earnings rose by 6 cents, or 0.3 percent, over the month.
Establishment Data
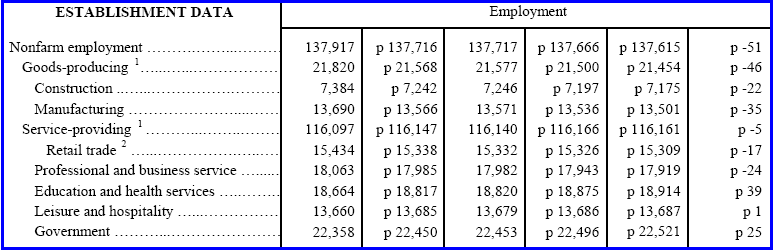
The establishment data was the 7th consecutive decline.
Highlights
- 22,000 construction jobs were lost
- 35,000 manufacturing jobs were lost
- 17,000 retail trade jobs were lost
- 24,000 professional and business services jobs were lost
- 5,000 service providing jobs were lost
- 1,000 leisure and hospitality jobs were added
- 25,000 government jobs were added
These are clearly recession totals.
Birth/Death Model Absurd Once Again
This was a very weak jobs report. And once again the Birth/Death Model assumptions are absurd. However, they are back in orbit this month, somewhere near Mars, from deep outer space where they have been since February.
Every month I say the same nearly the same thing. The only difference is the numbers change slightly. Here it is again: The BLS should be embarrassed to report this data. There is a difference this month. The data is back in the solar system. I expected a massive negative revision downward this month (my call was -425,000) and the reason is that January and July are the months that the BLS makes some effort to catch up with past ridiculousness.
And there is a ton of past ridiculousness to catch up on, in the construction, financial activities, and professional & business service categories. Note the January number of -378,000. I expected another month similar to that, but it was not to be, not this month anyway. The economy is clearly in contraction and the BLS model still has the economy expanding, although just barely.
Repeating what I have been saying for months now, virtually no one can possibly believe this data. The data is so bad, I doubt those at the BLS even believe it. But that is what their model says so that is what they report.
BLS Black Box
For those unfamiliar with the birth/death model, monthly jobs adjustments are made by the BLS based on economic assumptions about the birth and death of businesses (not individuals). Those assumptions are made according to estimates of where the BLS thinks we are in the economic cycle.
The BLS has admitted however, that their model will be wrong at economic turning points. And there is no doubt we are long past an economic turning point.
Here is the pertinent snip from the BLS on Birth/Death Methodology.
- The net birth/death model component figures are unique to each month and exhibit a seasonal pattern that can result in negative adjustments in some months. These models do not attempt to correct for any other potential error sources in the CES estimates such as sampling error or design limitations.
- Note that the net birth/death figures are not seasonally adjusted, and are applied to not seasonally adjusted monthly employment links to determine the final estimate.
- The most significant potential drawback to this or any model-based approach is that time series modeling assumes a predictable continuation of historical patterns and relationships and therefore is likely to have some difficulty producing reliable estimates at economic turning points or during periods when there are sudden changes in trend.
The important point in this mess is that both the job data and employment data are much worse than appears at first glance (and the first glance looked horrid).
Table A-12
Table A-12 is where one can find a better approximation of what the unemployment rate really is. Let's take a look
If you start counting all the people that want a job but gave up, all the people with part-time jobs that want a full-time job, etc., you get a closer picture of what the unemployment rate is. The official government number jumped to 5.7%, but U-6 (the most inclusive number) rose .4 to10.3%. To the average Joe on the street unemployment feels more like 10.3% (if not 15%) than 5.7. Both numbers are poised to rise further. We are easily on pace for my 6% target by the end of the year.
Yesterday, in July Payroll Playbook, I discussed the ADP National Employment Report, and the ADP Small Business Report. I also made some predictions and here they are.
July Is A Revision Month For BLS
Looking ahead to the report on Friday, it important to consider that January and July are revision months for the BLS. Guessing at what the Birth/Death Model revision will be is certainly fraught with danger, but I am going to go out on a limb anyway.
My guess the Birth Death revision will be -425,000 and the actual reported jobs number for July will be -178,000, with unemployment rising to 5.7%. If the jobs number is negative, it would be the 7th consecutive monthly contraction. These are the kind of guesses that can make one look silly but there they are.
I am also anticipating the first outright contraction in the service sector even with the strength that ADP is reporting in small businesses. Whatever that strength is, I expect it to be flooded by losses this month and next given this June 25th report: U.S. Retail Store Closures Are Flirting with Six-Year High .
Scorecard
5.7% unemployment: Correct on the nose.
Jobs decline 7th consecutive month: Correct
Contraction in service sector: Correct barely, but I will take it.
Birth Death Revision -425,000: Huge miss as discussed above.
Headline number -178,000: Pretty bad miss but bear in mind that number was based on the expected huge revision in the Birth/Death number. And as I stated above, there is a huge amount of catching up in the BLS Model.
Looking ahead, I expect the service sector to weaken considerably. Bennegan's and Mervyn's both went bankrupt this week, Starbucks is closing 600 stores, mall vacancy rates are rising and a huge contraction in commercial real estate is finally started. There is no driver for jobs and states in forced cutback mode are making matters far worse.
Fore more on the problems facing states, please see Schwarzenegger Cuts Wages of 200,000 Workers and New York Governor Warns Of Economic Crisis .
Indeed, the Credit Crunch Has Reached Critical Mass and is now picking up steam. Unemployment is poised to soar. The 6% number I projected back in December with unempolyment then at 4.8% is now looking way too optimistic.
By Mike "Mish" Shedlock
http://globaleconomicanalysis.blogspot.com
Click Here To Scroll Thru My Recent Post List
Mike Shedlock / Mish is a registered investment advisor representative for SitkaPacific Capital Management . Sitka Pacific is an asset management firm whose goal is strong performance and low volatility, regardless of market direction.
Visit Sitka Pacific's Account Management Page to learn more about wealth management and capital preservation strategies of Sitka Pacific.
I do weekly podcasts every Thursday on HoweStreet and a brief 7 minute segment on Saturday on CKNW AM 980 in Vancouver.
When not writing about stocks or the economy I spends a great deal of time on photography and in the garden. I have over 80 magazine and book cover credits. Some of my Wisconsin and gardening images can be seen at MichaelShedlock.com .
© 2008 Mike Shedlock, All Rights Reserved
Mike Shedlock Archive |
© 2005-2022 http://www.MarketOracle.co.uk - The Market Oracle is a FREE Daily Financial Markets Analysis & Forecasting online publication.