


Deutsche Bank Settlement: Seasonal Intraday Charts Provide Evidence for Gold Market Manipulation
Commodities / Gold and Silver 2016 Dec 24, 2016 - 09:43 AM GMTBy: Dimitri_Speck

Deutsche Bank trader: "u just said u sold on fix."
Answer UBS trader: "yeah, we smashed it good."
Deutsche Bank is a defendant in more than 7,000 lawsuits worldwide. In two of them it has recently agreed to settlements and is prepared to pay tens of millions of US dollars in restitution and fines. This includes the settling of lawsuits over gold and silver price manipulation. Associated court proceedings against other financial institutions are still underway.
Apart from Deutsche Bank, several other banks have been sued in New York over manipulation of precious metals prices as well. Due to a lack of direct evidence, the plaintiffs initially presented statistical evidence. Charts that show average intraday price movements have played an important role in this. How did this come about?
Detecting Market Manipulation with Charts of Average Intraday Price Movements
In 2002 I had the idea to create a chart of average intraday price patterns in order to investigate potential gold price manipulation. For this purpose I used the one-minute intraday prices of gold over a time period of five years and calculated an average of these prices over the course of one trading day.
The chart created at the time is depicted below. It shows the average intraday movements in the gold price from August 1998 to May 2002. The horizontal scale shows the time of the day, the vertical scale the average price level.
The chart therefore shows the typical intraday pattern in the gold price over a time period of more than one thousand trading days, based on millions of individual prices. Thus the chart has a high degree of statistical significance.
Gold, average intraday movements, 8/1998 - 5/2002.
The gold price typically declined at the time of the PM fixing in London (10:00 am EST)
Source: Dimitri Speck, Seasonax
As can be seen, the gold price typically fell during the first two hours of trading in New York, particularly at the time of the London PM fixing at 10:00 am EST. Such a regularly recurring anomaly at a point in time at which reference prices are determined represents strong circumstantial evidence of price manipulation.
It furnishes almost conclusive proof if other causes such as statistical outliers can be firmly excluded. Apparently a number of market participants deliberately suppressed prices at the time of the fixing, possibly in order to profit from subsequent transactions tied to the reference price.
The chart shown above illustrated for the first time that the gold price was manipulated at the time of the fixing. It was inter alia published on the internet, where it can still be found today, e.g. here: www.gold-eagle.com/article/gold-manipulation-intraday-charts.
Later I conducted similar studies of silver and platinum prices. These also led to the finding that prices were manipulated at the time of the fixing. In 2010 I documented the exciting history of manipulation in precious metals markets in my bestselling book Geheime Goldpolitik (Finanzbuchverlag), which was published in 2013 in English as The Gold Cartel (Palgrave Macmillan).
These studies gained wide recognition in expert circles, but no noteworthy legal or policy consequences ensued. The supervisory authorities were unable to prove that manipulation had taken place.
"Libor-Hunter" Rosa Abrantes-Metz Gets Involved
The situation changed abruptly in December 2013, when Ms. Rosa Abrantes-Metz took up the topic of gold price manipulation in a Bloomberg editorial, with reference to my average intraday price charts.
Ms. Abrantes-Metz had previously contributed decisively to exposing manipulation of Libor. The Libor scandal raised the public's awareness of the fact that systematic manipulation existed even in very large markets.
Since then events have unfolded rapidly. The fixings were replaced with more modern processes - and numerous lawsuits were filed, in which the method for determining average intraday price movements I have developed is used to provide evidence for price manipulation.
With success, as the settlement agreed to by Deutsche Bank demonstrates. As part of the settlement the bank undertook that internal business communications relevant to the case would be made available to the plaintiffs. So far it has provided 350,000 pages in total, which are going to be introduced as evidence in lawsuits against other banks.
The statistical evidence that has been available to date has now been complemented by direct evidence from these internal records. The first excerpts that have been published confirm beyond doubt that manipulation has indeed taken place.
Gold: Suspicion of Manipulation Continues to Linger
What is the situation these days though? Thanks to the Seasonax app that is nowadays available at Bloomberg and Thomson Reuters, I am able to replicate work that has taken me weeks to complete in 2002 within seconds: namely the creation of precise charts of average intraday price movements.
The next chart illustrates the average intraday pattern in the gold price over the past six months until mid December 2016.
Gold, average intraday price movements from 6/2016 - 12/2016.
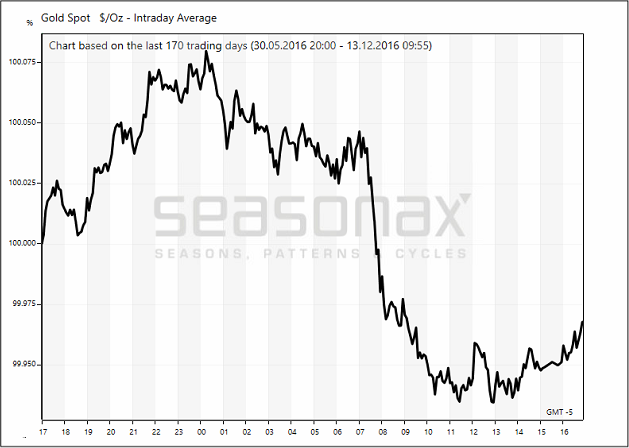
Gold prices are regularly sliding in early New York trading
Source: Seasonax
As can be seen above, there are no longer any conspicuous price moves at the time of the by now revised fixing at 10:00 am EST. It seems that manipulation of the fixing is over and done with!
Nevertheless, a noticeable price slide still occurs regularly in early New York trading - price behavior that is reminiscent of the time after August 5 1993, when manipulation of the gold price could first be detected.
Conclusion
Systematic manipulation of gold prices has been in evidence for more than 23 years. This is probably a record for a market that is supposed to be free of interventions. The idea was initially mooted by the Fed, which at the time wanted to push down inflation expectations and raise confidence in the US dollar. This was first hinted at in Forbes magazine in 1995, in 1998 GATA was founded with the goal of getting to the bottom of the allegations and statistical evidence for the manipulation of prices has been available since the turn of the millennium - inter alia my contribution concerning the fixing.
The lawsuits filed to date are focused on manipulation of precious metals prices at the time of the fixing as well. As a result of the settlement entered into by Deutsche Bank and the release of the bank's internal documents a more far-reaching probe has now become possible. Hopefully all parties concerned - including government agencies - will admit to their involvement in gold price manipulation in coming years.
Dimitri Speck,
Dimitri Speck is the founder of Seasonax and author of The Gold Cartel, published by Palgrave Macmillan.
© 2016 Copyright Dimitri Speck - All Rights Reserved - Disclaimer: The above is a matter of opinion provided for general information purposes only and is not intended as investment advice. Information and analysis above are derived from sources and utilising methods believed to be reliable, but we cannot accept responsibility for any losses you may incur as a result of this analysis. Individuals should consult with their personal financial advisors.
© 2005-2022 http://www.MarketOracle.co.uk - The Market Oracle is a FREE Daily Financial Markets Analysis & Forecasting online publication.