


Bullish Case for GBP/JPY
Currencies / Forex Trading Feb 09, 2017 - 04:24 PM GMTBy: MarketsToday

 Looking back we see that the GBPJPY moved into a 16-month downtrend following the 195.87 peak reached in June 2015. Support was eventually found at 124.59 four months ago. It was promptly followed by a sharp nine-week rally up into 148.45 resistance (most recent peak). That price area is where both support and resistance were seen back in 2013, at resistance of the 55-week exponential moving average (ema), and at the 61.8% Fibonacci retracement of the internal downtrend (coming off the 168.08 lower swing high).
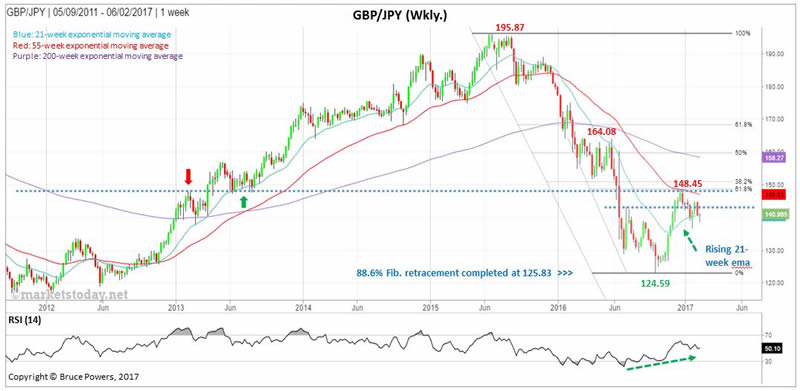
The rally triggered a number of long-term bullish signals that point to a likely change in trend, including:
- Decisive close above the 21-week ema on a weekly and monthly basis
- Close above two prior swing highs (long-term downtrend price structure)
- Broke above long-term downtrend line
- Rallied above 200-day ema
- Bullish crossover of 21-day ema and 55-day ema
- Rising 21-day ema
Since the 148.45 peak the GBPJPY retraced 50% of the prior rally with support being found at 136.45 three weeks ago. The pair is now working to further strengthen off that low. That low also completes a test of support of the downtrend line following a move above it in early-December. This is further bullish behavior as the line was long-term resistance and is now confirmed as support.
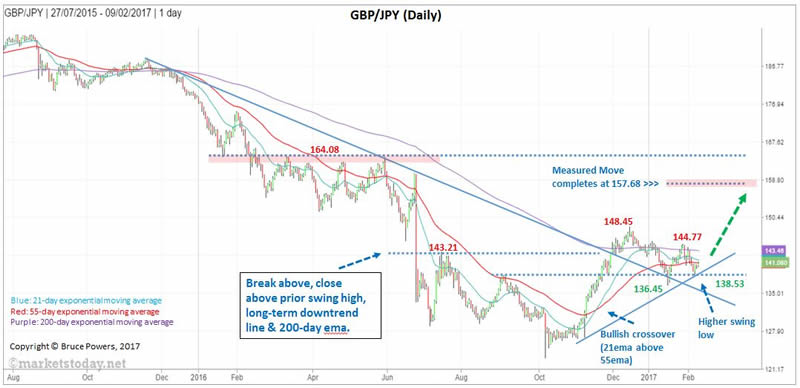
The next confirmation of strength is given on a move above 144.77 (recent minor peak) with the pair then heading towards a test of the 148.45 swing high and a likely move above it. Based on price structure the standout target would then be around the 164 peak from earlier in 2016.
However, the first high probability target zone is from approximately 157.68 (completion of measured move or ABCD pattern) to 158.37 (200-week ema). A measured move reflects symmetry between market swings. In this case the completion of the measured move is where the second leg up in the uptrend matches the price appreciation of the first leg up (off October 124.59 low).
An alternative to the above bullish scenario is that the GBPJPY falls below the 136.45 swing low from three weeks ago leading to a deeper retracement of the November rally. (www.marketstoday.net/en/)
Bruce Powers, CMT
Chief Technical Analyst
http://www.marketstoday.net/
© 2017 Copyright Bruce Powers- All Rights Reserved
Disclaimer: The above is a matter of opinion provided for general information purposes only and is not intended as investment advice. Information and analysis above are derived from sources and utilising methods believed to be reliable, but we cannot accept responsibility for any losses you may incur as a result of this analysis. Individuals should consult with their personal financial advisors.
© 2005-2022 http://www.MarketOracle.co.uk - The Market Oracle is a FREE Daily Financial Markets Analysis & Forecasting online publication.