


3 Ways to Quantify Risk in Today’s Murky Markets
Stock-Markets / Financial Markets 2017 Feb 21, 2017 - 05:24 PM GMTBy: John_Mauldin

 Credit Indicators
One way to calculate market risk is through bond yields. As risk and return are directly correlated when a bond’s yield rises, it implies the risk of owning it has increased.
The main vehicle for measuring risk through yield is the US 10-year Treasury. The 10-year is the bellwether for global bonds as it’s considered a “risk-free” instrument. Since hitting all-time lows in July 2016, its yield has shot up 50%.
In short, investors now demand a 50% higher premium for investing in the “risk-free” benchmark. Clearly, the markets perception of danger has increased.
Next, let’s look at the TED spread. This measures the price difference between 3-month futures contracts for T-Bills and 3-month contracts for eurodollars. T-bills are considered risk-free, while eurodollar futures reflect the credit ratings of corporate borrowers. As the TED spread increases, default risk is considered to be rising.
Based on the following chart, the TED spread increase may not look significant—in part because the 2008–2009 move was so dramatic—but it’s up 70% since 2013. And its path is similar to 2003–2007 when it climbed 76% before hitting all-time highs during the 2008 crisis.
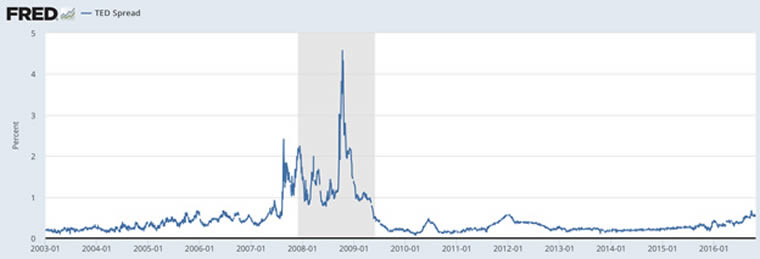
The TED spread has been an accurate predictor of rising delinquency rates over the past three decades. With credit indicators starting to deteriorate, how are equities reading the situation?
Equity Gauges
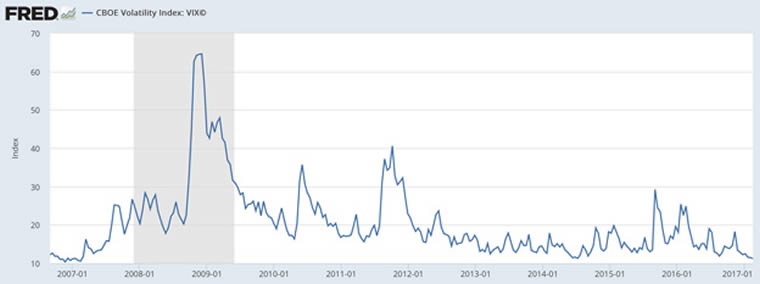
The CBOE Volatility Index (VIX) measures market expectations of near-term volatility based on S&P 500 index options. Known as the “fear-gauge,” the VIX has tended to rise in times of panic and fear.
When the index reads 30 or above, there is usually heightened amounts of uncertainty present. When it’s 20 or below, conditions are viewed as favorable.
Currently, the VIX has been hovering around the 11 handle since January. Such prolonged flatness hasn’t been seen since 2007. It’s worth noting after that period, the index rose 85%, hitting record highs as Lehman Brothers collapsed.
Current readings suggest investors have almost erased the possibility of market strife in the near term. This has led the Bank of International Settlements (BIS) to crown the US dollar the “new-fear index” as the VIX is no longer functioning as intended.
Today, the VIX is so depressed that the S&P 500 hasn’t seen a 1% intraday move since December 14. At over 40 trading sessions, that’s its longest streak ever.
So, what are credit markets seeing that equities aren’t?
As investors know, currency (FX) markets have experienced extreme moves in recent times. These moves have been attributed to the unconventional monetary policy of the past nine years. The recent gyrations in bonds indicate this volatility is now shifting from FX into credit markets.
Investment firm KKR and the BIS have recently discussed this shift in volatility, with both expecting it to show up in equities over the medium term. Having looked at separate measures of risk through bonds and equities, how can we roll this picture into one?
The Golden Constant
An indicator of market risk used long before volatility indices existed is gold. Nicknamed “the fear trade,” investors have flocked to the metal in times of turmoil. We can see this with the big gains gold has enjoyed following the 2001 and 2008 market crashes. Gold also has a negative correlation to the S&P 500.
Since hitting $1,050—a multi-year low in December 2015—gold is up 18% (see the gold price per ounce and silver per ounce charts). So, why was 2016 investment demand for gold the second highest on record even as equities made all-time highs?
Gold has caught onto warning signs coming out of credit markets and elsewhere. Measured on a monthly basis, the economic policy uncertainty index is at its highest levels since 2013. Given the ambiguity around Washington’s policies and the Fed’s rate hike path, this is no surprise.
With objective measures of risk rising, we think now is an excellent time to add gold to your portfolio. And we are not alone in our thinking. Inflows into gold ETFs have been strong since January.
Also, legendary hedge fund manager Stanley Druckenmiller recently bought back into the yellow metal. In an interview with Bloomberg, Druckenmiller said, “I wanted to own some currency and no country wants its currency to strengthen. Gold was down a lot, so I bought it.”
Remember, allocated physical gold is the only financial asset not simultaneously somebody else’s liability. In times of rising uncertainty and volatility, this is a vital attribute to have.
Free Ebook: Investing in Precious Metals 101: How to buy and store physical gold and silver
Download Investing in Precious Metals 101 for everything you need to know before buying gold and silver. Learn how to make asset correlation work for you, how to buy metal (plus how much you need), and which type of gold makes for the safest investment. You’ll also get tips for finding a dealer you can trust and discover what professional storage offers that the banking system can’t. It’s the definitive guide for investors new to the precious metals market. Get it now.
John Mauldin Archive |
© 2005-2022 http://www.MarketOracle.co.uk - The Market Oracle is a FREE Daily Financial Markets Analysis & Forecasting online publication.