


USDCAD Is Facing Channel Support
Currencies / Canadian $ May 30, 2017 - 03:47 PM GMTBy: Franco_Shao

 USDCAD has reached the bottom trend line of the ascending price channel on its daily chart which acts as support for the upside movement. As long as the price is above the bottom trend line, the pair remains in bullish structure and the fall from May 5 high of 1.3793 could be treated as correction of the uptrend from January 31 low of 1.2968, another rise towards 1.4000 could be expected after the correction. All we should do now is to wait for the breakout to occur.
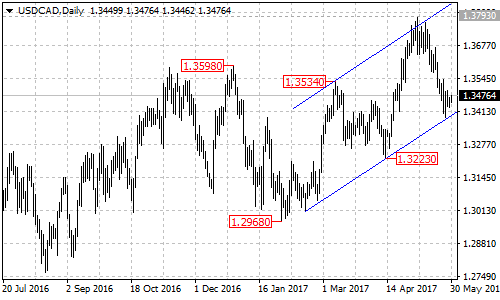
USDCAD Daily Chart
The upside breakout
On the 4-hour chart, there is a descending price channel which provides resistance at the top trend line. A clear break out of the channel resistance could take price to the next resistance level of 1.3540 which acts as the key resistance to the correction of the short term downtrend from 1.3793. Above this level will indicate that the downtrend had completed at 1.3387 already, this could signal resumption of the uptrend from 1.2968 and the target for this uptrend would be at the top of the channel.
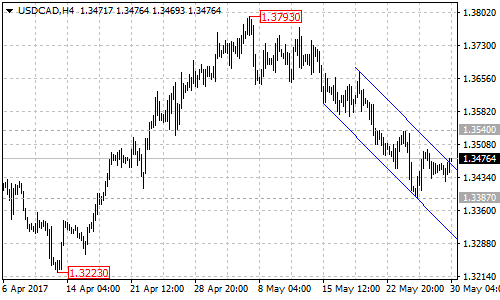
USDCAD 4-hour Chart
The downside breakout
On the downside, a clear break below the support trend line of channel on the daily chart will suggest that the uptrend from 1.2968 had completed at 1.3793 already, then deeper decline could be seen, and the target would be at the bottom of the price channel on its weekly chart now at around 1.3180.
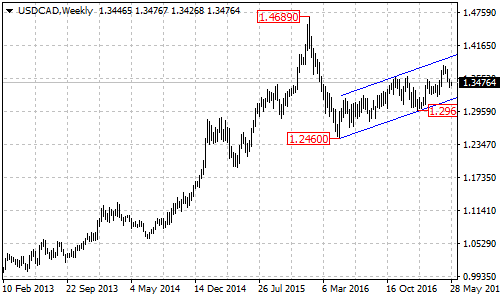
USDCAD Weekly Chart
Technical levels
Support levels: 1.3380 (the bottom of the price channel on daily chart), 1.3180 (the bottom of the price channel on weekly chart).
Resistance levels: 1.3470 (the top of the price channel on 4-hour chart), 1.3540 (the key resistance for the short term downtrend), 1.3793 (May 5 high), the top of the price channel on daily chart.
This article is written by Franco Shao, a senior analyst at ForexCycle.
© 2017 Copyright Franco Shao - All Rights Reserved Disclaimer: The above is a matter of opinion provided for general information purposes only and is not intended as investment advice. Information and analysis above are derived from sources and utilising methods believed to be reliable, but we cannot accept responsibility for any losses you may incur as a result of this analysis. Individuals should consult with their personal financial advisors.
© 2005-2022 http://www.MarketOracle.co.uk - The Market Oracle is a FREE Daily Financial Markets Analysis & Forecasting online publication.