


Relationship between Crude Oil Price and Oil Stocks
Commodities / Oil Companies Nov 22, 2017 - 12:46 PM GMTBy: Nadia_Simmons

 Although verification of the last week breakdown under important resistance line pushed black gold under $56, oil bulls didn’t give up and triggered a pullback. What does it mean for light crude? Will the relationship between crude oil and oil stocks give us more clues about future moves?
Crude Oil’s Technical Picture
Before we try to answer these questions, let’s examine the technical picture of crude oil (charts courtesy of http://stockcharts.com).
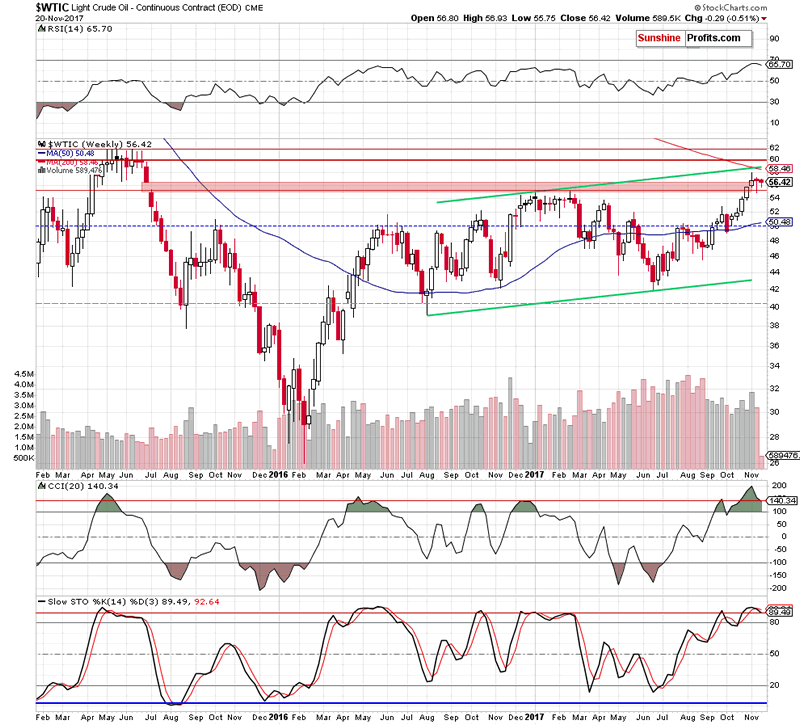
Looking at the weekly chart, we see that the overall situation in the medium term hasn’t changed much as crude oil is still trading in a narrow range around the upper border of the red gap created in 2015. Nevertheless, the current position of the indicators (the sell signal generated by the Stochastic Oscillator and one of the highest readings of the RSI and the CCI since the beginning of the year) continues to favor oil bears.
Having said the above, let’s examine the very short-term chart and find out what we can infer from it.
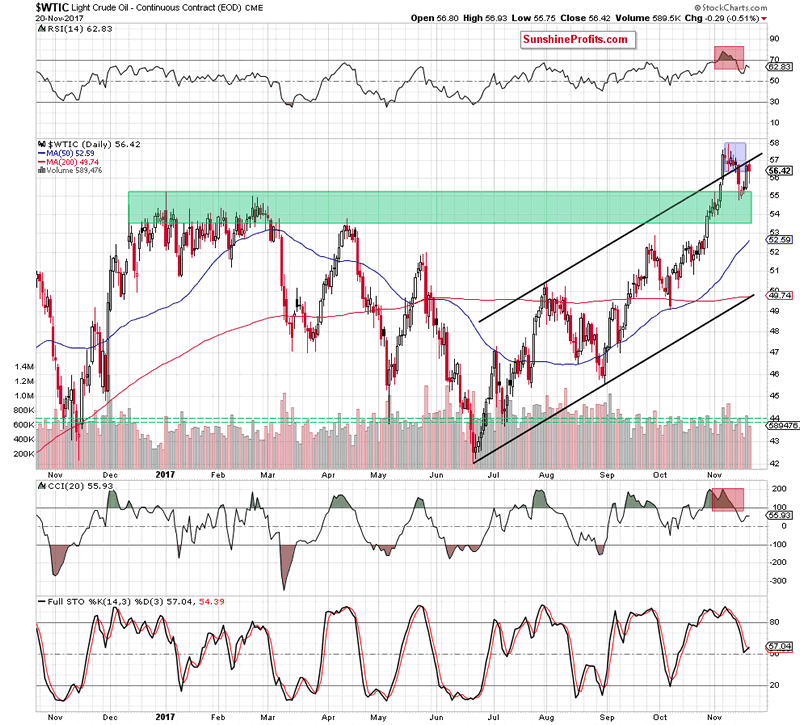
From the daily perspective, we see that Friday’s verification of the earlier breakdown under the upper border of the black rising trend channel encouraged oil bears to act yesterday. Although their opponents tried to push the commodity higher after the market’s open, they failed, which resulted in a drop below $56.
Despite this deterioration, the proximity to the green support zone attracted oil bulls and triggered a rebound – quite similar to what we already saw on Tuesday. Nevertheless, yesterday’s move wasn’t enough to push the price of light crude above the black resistance line, which means that as long as there is no invalidation of the breakdown below it, lower values of black gold are more likely than not – especially when we factor in the situation in the oil-to-gold and oil-to-stock market ratios (we wrote more about them on Wednesday and Friday).
Continuing to examine the relationship between crude oil and other elements of the market, we decided to take a closer look at the oil-to-oil stocks ratio.
Crude Oil – Oil Stocks Link
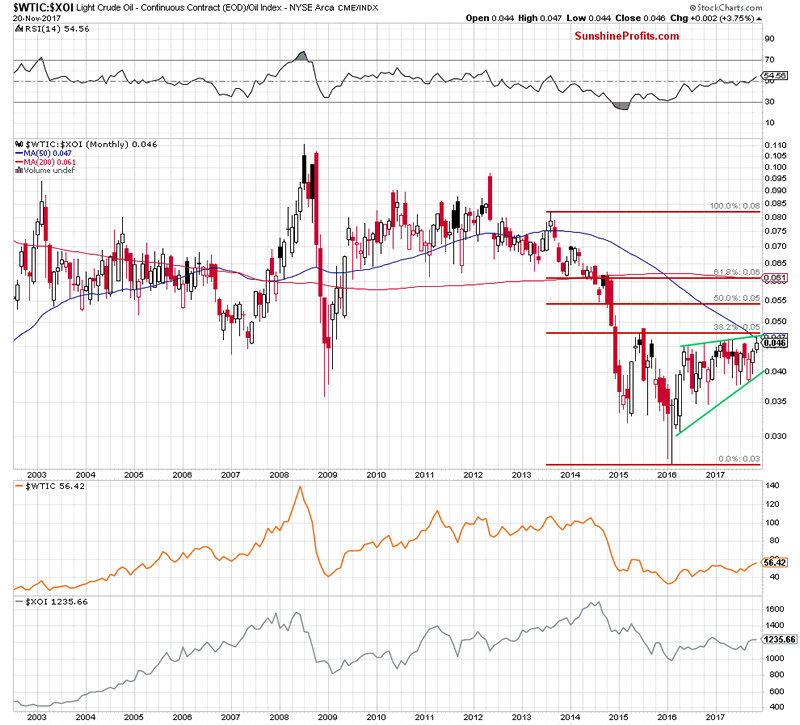
Looking at the long-term chart, we see that although the ratio extended gains in November, it is still trading under a very important resistance zone created by the upper border of the green rising wedge, the 50-week moving average and the 38.2% Fibonacci retracement.
This area is also reinforced by the red gap marked on the weekly chart below.
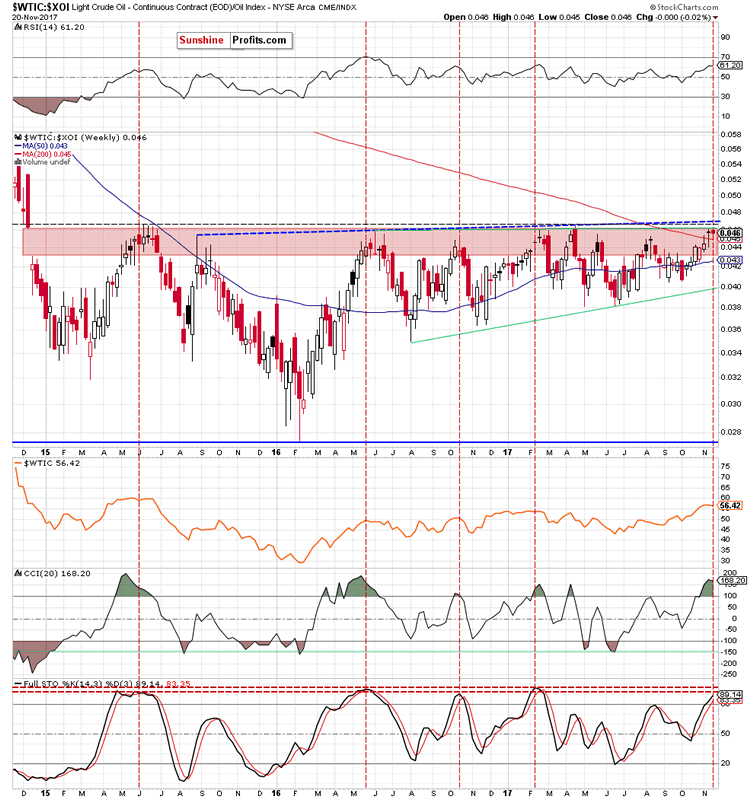
As you see on the above chart, the red gap continues to keep gains in check since 2015. Although the bulls pushed the ratio to this area many times in the past, all their attempts to go north failed, which translated into declines in the following weeks. We saw such price action in June, August 2015, in May, June, October 2016, in February, March, April, May and August 2017.
What happened with crude oil at the same time? In all the above-mentioned cases we noticed declines in light crude, which confirms that there is a positive correlation between the ratio and black gold (similarly to what we wrote in the case of the oil-to-gold and oil-to-stocks ratios). Therefore, in our opinion, if the oil-to-oil stocks ratio reverses and declines in the very near future, we will also see lower prices of crude oil in the following days.
If you enjoyed the above analysis and would like to receive free follow-ups, we encourage you to sign up for our daily newsletter – it’s free and if you don’t like it, you can unsubscribe with just 2 clicks. If you sign up today, you’ll also get 7 days of free access to our premium daily Oil Trading Alerts as well as Gold & Silver Trading Alerts. Sign up now.
Nadia Simmons
Forex & Oil Trading Strategist
Przemyslaw Radomski
Founder, Editor-in-chief
Sunshine Profits: Gold & Silver, Forex, Bitcoin, Crude Oil & Stocks
Stay updated: sign up for our free mailing list today
* * * * *
Disclaimer
All essays, research and information found above represent analyses and opinions of Nadia Simmons and Sunshine Profits' associates only. As such, it may prove wrong and be a subject to change without notice. Opinions and analyses were based on data available to authors of respective essays at the time of writing. Although the information provided above is based on careful research and sources that are believed to be accurate, Nadia Simmons and his associates do not guarantee the accuracy or thoroughness of the data or information reported. The opinions published above are neither an offer nor a recommendation to purchase or sell any securities. Nadia Simmons is not a Registered Securities Advisor. By reading Nadia Simmons’ reports you fully agree that he will not be held responsible or liable for any decisions you make regarding any information provided in these reports. Investing, trading and speculation in any financial markets may involve high risk of loss. Nadia Simmons, Sunshine Profits' employees and affiliates as well as members of their families may have a short or long position in any securities, including those mentioned in any of the reports or essays, and may make additional purchases and/or sales of those securities without notice.
© 2005-2022 http://www.MarketOracle.co.uk - The Market Oracle is a FREE Daily Financial Markets Analysis & Forecasting online publication.