


Bitcoin Price Analysis – Bullish Golden Cross on the Hourly?
Currencies / Bitcoin Jul 17, 2018 - 02:39 PM GMTBy: Submissions

 John Lee Quigley writes: $6400 was acting as a significant resistance level for Bitcoin’s price, however, over the last hour, the price has managed to break to the upside and is currently trading above the $6500 level. The move up over the last hour was on significant volume showing there is some weight behind the move which contrasts heavily with last weeks price action when many were speculating a return to sub-$6000 levels.
On the hourly chart, we also have the 50EMA crossing over the 100EMA to the upside, and if the price keeps trading near the level it’s at now, the 50EMA will be set to crossover the 200EMA to the upside, a bullish sign known as a Golden Cross.
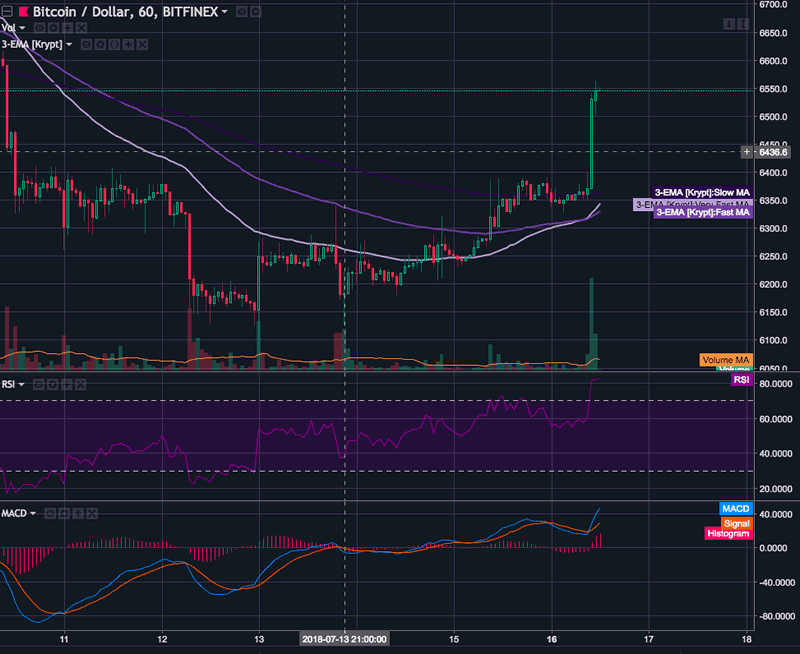
Bitcoin Hourly Chart
On a longer-term outlook, we still have significant resistance around the $6850 point with many of the daily moving averages around this point. This is also a point that price has previously struggled to get through. If the price does manage to break through the $6850 resistance level some of the longer term trend pattern of lower lows and lower highs will break down which would make a strong case for a more bullish outlook going forward.
This is the third consecutive green day for Bitcoin. The previous two green days were on low volume but also occurred over the weekend which tends to be quiet days for the crypto markets regardless. However, today’s gains are on more significant volume and is a promising start to the week for traders looking to go long and of course the hodlers.
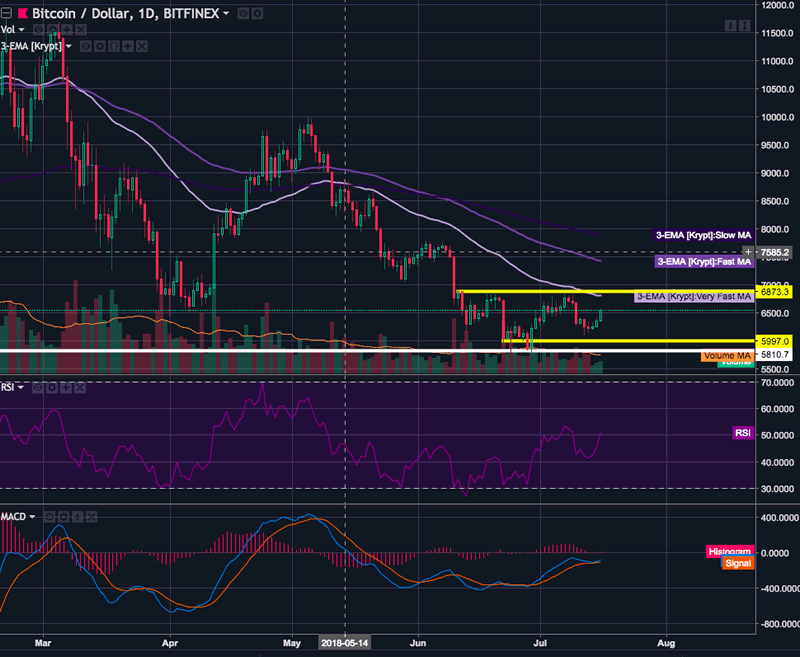
Bitcoin Daily Chart
Takeaways:
- Bitcoin managed to break through the resistance at $6400 on significant volume.
- Heavy resistance to be expected at the $6850 level.
- The next key levels to take into consideration are $6400 as support and $6850 as resistance.
- It’s worth monitoring for a Golden Cross on the hourly chart.
Enjoyed this cryptocurrency analysis? Then visit blokt.com and sign up to our Newsletter, Twitter or Telegram channel free of charge. You'll get access to followups, further TA, daily news, Tether print notifications, and much more.
Best,
Darren Brazer
Managing Editor
blokt.com
DISCLAIMER: Investing or trading in digital assets, such as those featured here, is extremely speculative and carries substantial risk. This analysis should not be considered investment advice, use it for informational purposes only. Historical performance of the assets discussed is not indicative of future performance. Statements, analysis, and information on blokt and associated or linked sites do not necessarily match the opinion of blokt. This analysis should not be interpreted as advice to buy, sell or hold and should not be taken as an endorsement or recommendation of a particular asset.
© 2005-2022 http://www.MarketOracle.co.uk - The Market Oracle is a FREE Daily Financial Markets Analysis & Forecasting online publication.