


Gold Forecast Target $2,500 and Silver $250
Commodities / Gold & Silver Sep 18, 2008 - 03:26 PM GMTBy: Peter_Degraaf

 That's ridiculous' I can hear someone saying. But is it really all that far-fetched?
Let's begin by adjusting the previous high gold price of $850 set in 1980, into today's dollar value. By using the US government's own inflation calculator (bls.gov/data/inflation-calculator.htm or simply Google ‘BLS inflation calculator'), we find out that gold should be trading at $2,260 to match the 1980 high of $850
For silver the price today should be $129 to match the 1980 high of $48.
If one were to use the statistics maintained by John Williams at Shadowstats.com the numbers would be twice as high: close to $5,000 for gold and well over $250 for silver.
We need to keep in mind that there are today several billion people who were not part of the global population back then. According to Goldman-Sachs an estimated 70 million people worldwide are entering the middle class each year. Once people attain middle class status, they will work hard to stay there or advance higher still.
It is a coincidence that in two rapidly rising economies ( China and India ), the population has a centuries old attraction to precious metals.
The action in gold and silver during the past few days is an indication of how rapid the price rise can be. In a previous article I used the metaphor of a beach ball held under water. The deeper you push the ball the faster it rises once released.
The commercial gold traders who were ‘net short' 247,000 contracts as reported on July 18 th , have reduced this position to being ‘net short' 94,000 contracts as of last week.
The commercial traders could tell that the ‘beach ball was about to pop up.'
Lease rates for gold have doubled during the past 30 days. This is going to have the effect of having less Central Bank gold released into the marketplace via leasing. Meanwhile more and more money is being created worldwide to pay for government promises and various bailouts, as government officials and politicians almost always use monetary inflation instead of taxation to pay the bills.
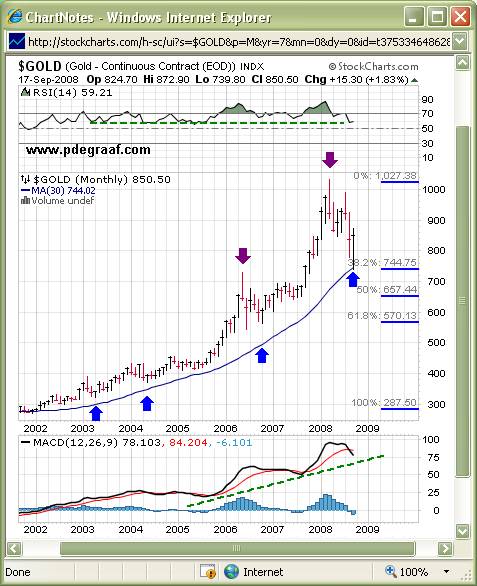
Chart courtesy www.stockcharts.com
Featured is the monthly gold chart with the 30 month moving average. The arrows point to upside reversals (blue) or downside reversals (purple). When they appear on a monthly chart, they often are powerful indicators for future direction. The latest one needs to close at this level or above, by September 30 th , to indicate to us that the gold trend has turned bullish again. The bottom of this months range is right at the Fibonacci 38.2% correction level which adds all the more credibility to the possibility that this will turn out to be an upside reversal. The supporting indicators are near support levels (green lines), and in the case of the RSI it is already turning up again.
There are many factors driving this 6 year old bull market.
- Worldwide monetary inflation.
- US CPI rising at 4% or more yr/yr
- US PPI rising at double digit rates yr/yr
- While oil prices have stabilized at levels well below the $145 a gallon mark, energy consumption worldwide continues to rise, which causes price inflation to continue. In August, PEMEX reported that Mexican crude production fell 20% thus far in 2008 compared to 2007. It is expected that Mexico will have to import oil within 4 years. The International Energy Agency recently raised its demand forecast for worldwide oil consumption, despite a 4.6 drop in US demand. Claims of Saudi oil reserves are highly suspect. Without any new oilfields having started to produce there, reserves nevertheless are listed at some 15 billion barrels above 1978 levels, after oil has been pumped out all these years. The end to the bull market in oil will only come after a worldwide reduction in consumption, or several years after some major oil discoveries.
- The US budget deficit for 2008 is predicted to be at least double that for 2007.
- Gold supply continues to taper off, as the cost of building a gold mine, not to mention the amount of paperwork involved, is deterring new mine building. Production in South Africa is expected to be 10% below 2007.
- Commodity cycles run on average 20 years. The current gold cycle is barely one third of the way into that cycle.
- In May of 2008, Richard Fischer, President of the Dallas Federal Reserve indicated that the US Federal debt including Medicare is close to 99 trillion dollars. Since taxation is not an option for such a large amount, the printing press will be running overtime.
- China and Japan between them hold some 2 trillion dollars in US bills and Treasuries. The interest that has to be paid on this debt has to be created month after month.
- There is ongoing pressure on the US dollar since it reached resistance on the charts at ‘80'. The Federal Reserve is unlikely to raise interest rates to support the dollar until the housing crisis is settled, and that could take a while.
- “Real interest rates' (T-bills less CPI) are negative, according to the Federal Reserve. (See chart below). Gold always rises when real rates are negative.
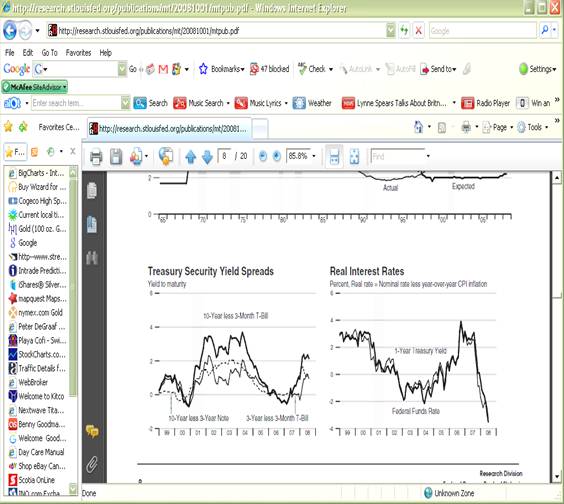
Chart courtesy Federal Reserve Bank of St. Louis . The ‘Real Interest Rate' is approaching -.4%
Next the daily ‘nearest futures' gold chart.
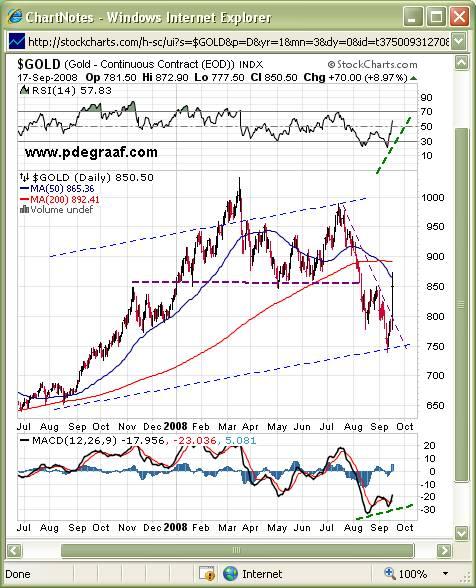
Gold on Wednesday cut through the two-month old resistance like a hot knife through butter. The supporting indicators turned positive (green lines). Price closed at the
horizontal resistance line (cash gold closed above it). There is of course the possibility of price consolidation here before a resumption of the new uptrend, but in the main the short-term trend has matched the long term bullish uptrend (blue channel) once again.
The seasonal lows which sometimes arrive in June, and last year bottomed in August, came in a month late this year, causing some to wonder if the bull market in gold was over. It would appear that the market answered that question on Wednesday, with a resounding NO!
My Gold Direction Indicator which had been at +80% for the previous two days, shot up to +100% at the close on Wednesday.
By Peter Degraaf.
Peter Degraaf is an on-line stock trader, with over 50 years of investing experience. He issues a weekly alert to his subscribers. For a 60 day free trial, send him an E-mail itiswell@cogeco.net , or visit his website www.pdegraaf.com
DISCLAIMER: Please do your own due diligence. I am NOT responsible for your trading decisions.
Peter Degraaf Archive |
© 2005-2022 http://www.MarketOracle.co.uk - The Market Oracle is a FREE Daily Financial Markets Analysis & Forecasting online publication.