


GBP/USD – Double Bottom or Further Declines?
Currencies / British Pound Nov 29, 2018 - 03:02 PM GMTBy: Nadia_Simmons

In the previous week, GBP/USD wavered around the lower border of the declining trend channel. Yesterday, currency bears pushed the pair below it, testing the mid-November low. Will we see a post-double-bottom rally in the following days?
Which Way Next for EUR/USD?
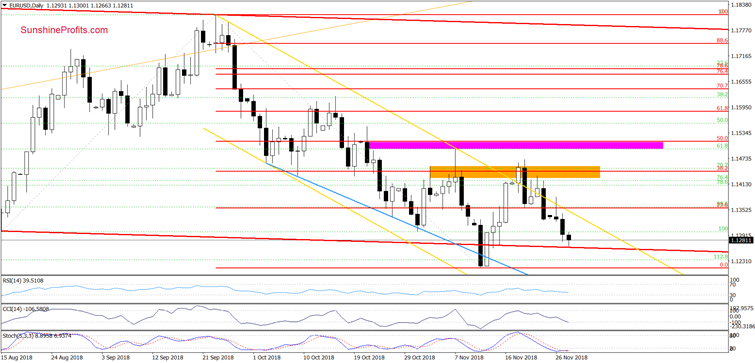
On Monday, we wrote that the buyers pushed the pair above the yellow line once again, but as it turned out this improvement was very temporary, and EUR/USD pulled back, invalidating the breakout for the third time in a row. Such price action increases the probability that we’ll likely see further deterioration and a test of the lower border of the red declining trend channel (or even the recent lows) in the coming days.
From today’s point of view, we see that the situation developed in line with the above scenario and the exchange rate touched our first downside target earlier today. As you see on the chart, the lower border of the red trend channel triggered a tiny (compared to earlier declines) rebound in the following hours, but as long as there are no buy signals generated by the daily indicators and a comeback above the yellow resistance line, one more downswing and a test of the next downside target is likely.
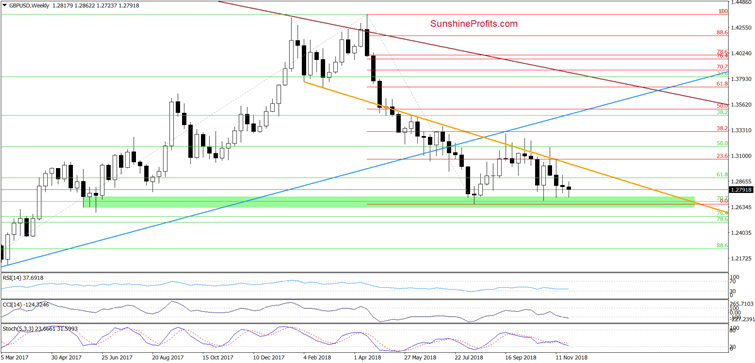
Looking at the weekly chart, we see that GBP/USD slipped to the green zone once again. As you see, this major support area was strong enough to stop the sellers three times in the past, which suggests that as long as there is no successful breakdown below it a bigger move to the downside is not likely to be seen and one more rebound from here should not surprise us – especially when we factor in the short-term picture below.
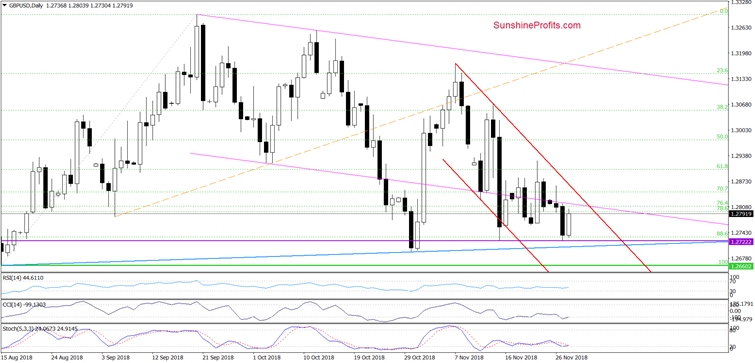
From this perspective, we see that the exchange rate dropped to the purple horizontal line based on the mid-November low during yesterday’s session. Earlier today, currency bulls bounced off this support, erasing almost entire Tuesday’s downswing and approaching the previously-broken lower border of the pink declining trend channel.
On one hand, such price action could be nothing more than a verification of the earlier breakdown, however, on the other hand, taking into account the probability of a double bottom, the proximity to the above-mentioned green support zone (marked on the weekly chart), the blue support line seen on the daily chart and the current position of the daily indicators, it seems that further improvement is just around the corner.
Nevertheless, in our opinion, a bigger move to the upside will be more likely and reliable if currency bulls manage to take the pair above the upper border of the red declining trend channel marked on the daily chart.
USD/CHF and Signs of Bulls’ Weakness
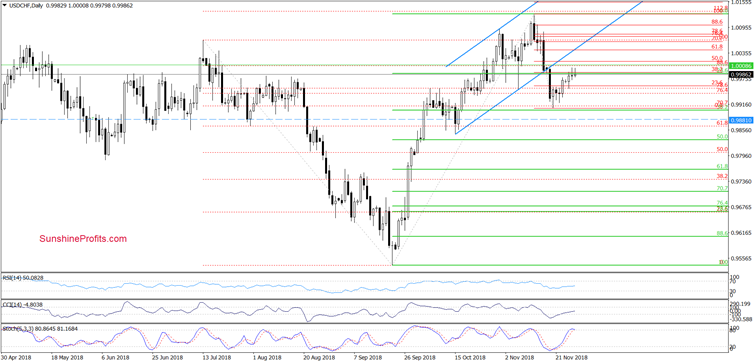
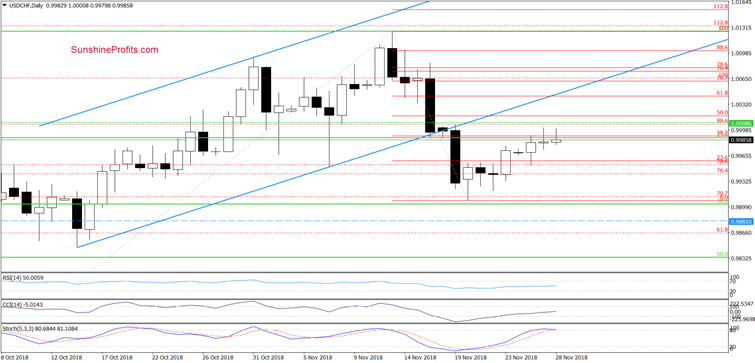
On the daily chart, we see that although USD/CHF increased a bit above yesterday’s high, the overall situation in the very short term remains almost unchanged as the pair is still trading inside the big black candlestick created on November 19.
Such price action suggests that currency bulls are quite weak compared to their opponents, because despite eight sessions they were not able to return above 1.0005 (the November 19 intraday high).
Additionally, when we take a closer look at the Fibonacci retracements based on the November declines, we see that the exchange rate invalidated yesterday’s tiny breakout above the 38.2% retracement. Earlier today, the history repeated itself once again, increasing the probability of reversal in the very near future.
This scenario is also reinforced by the current position of the Stochastic Oscillator, which is very close to generate a sell signal. At this point, it is worth noting that a similar reading of the indicator preceded the November 13 peak.
Connecting the dots, we think that another attempt to move lower is just around the corner. If this is the case and the pair reverses from current levels, we’ll likely see a test of the 38.2% Fibonacci retracement or even the mid-October lows in the coming week.
If you enjoyed the above analysis and would like to receive free follow-ups, we encourage you to sign up for our daily newsletter – it’s free and if you don’t like it, you can unsubscribe with just 2 clicks. If you sign up today, you’ll also get 7 days of free access to our premium daily Oil Trading Alerts as well as Gold & Silver Trading Alerts. Sign up now.
Nadia Simmons
Forex & Oil Trading Strategist
Przemyslaw Radomski
Founder, Editor-in-chief
Sunshine Profits: Gold & Silver, Forex, Bitcoin, Crude Oil & Stocks
Stay updated: sign up for our free mailing list today
* * * * *
Disclaimer
All essays, research and information found above represent analyses and opinions of Nadia Simmons and Sunshine Profits' associates only. As such, it may prove wrong and be a subject to change without notice. Opinions and analyses were based on data available to authors of respective essays at the time of writing. Although the information provided above is based on careful research and sources that are believed to be accurate, Nadia Simmons and his associates do not guarantee the accuracy or thoroughness of the data or information reported. The opinions published above are neither an offer nor a recommendation to purchase or sell any securities. Nadia Simmons is not a Registered Securities Advisor. By reading Nadia Simmons’ reports you fully agree that he will not be held responsible or liable for any decisions you make regarding any information provided in these reports. Investing, trading and speculation in any financial markets may involve high risk of loss. Nadia Simmons, Sunshine Profits' employees and affiliates as well as members of their families may have a short or long position in any securities, including those mentioned in any of the reports or essays, and may make additional purchases and/or sales of those securities without notice.
© 2005-2022 http://www.MarketOracle.co.uk - The Market Oracle is a FREE Daily Financial Markets Analysis & Forecasting online publication.