World Stock Market Indices: When to Start Buying Stocks Again?
Stock-Markets / Global Stock Markets Dec 29, 2018 - 02:41 PM GMT The World Indices have shown a sideways to lower year in 2018. The last Quarter alone World Indices lost their gains, for example, the SPX or the Dow Jones. Other World indices peaked earlier than others this year and some of them did not produce new highs again.
There is a lot of speculation going around the Market which results in many questions which need to be answered. We can hear a lot of experts calling different reasons and scenarios. It goes from a Political crisis to the Trade war with China, to the Feds raising interest rates and many more assumptions. However, the reality is that neither of the mentioned reasons can justify the latest moves in our opinion.
The Market as we always say is a combination of time frames, cycles, and sequences. And the only thing that matters is the way Market Makers (Smart money) trade them. We understand this is a big secret which even people in the media or in the public don’t even talk about it.
The way the Market works is what we call Market Nature and goes from Inflection areas to inflection areas. It is very simple. The Market makers know those inflection areas because they are doing the Market and consequently, they know when to turn and when to push one side over the other. The World Indices are not just the SPX or the Dow Jones. World Indices are the Indices across the World. We at www.Elliottwave-Forecast.com always relate instruments with other similar instruments, which is called market correlation. That allows us to follow the Instruments which are showing the clearest structure. Then we relate them with the rest and make the Elliott wave counts accordingly.
Many believe in the Elliott Wave Theory. We are using and practicing the Theory as well every day. But we understand that Elliott Wave on its own is not a reliable tool. We believe that the Market Makers do not use The Elliott Wave Theory to trade. They use sequences, cycles and relate them across the Market. They have the power to make the Market.
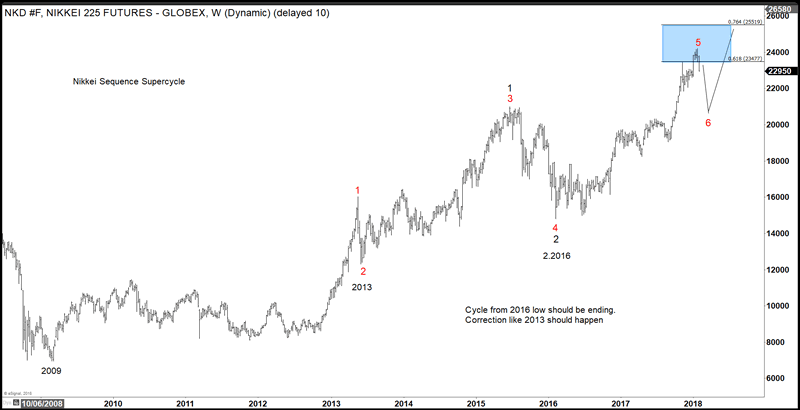
Coming to the recent decline. The decline which we are seeing is very Technical and can be seen across other markets as well which many traders don’t even recognize. Everything started in January 2018. The World Indices have reached a stage in which a decent pullback was expected. In the following chart, you can see the Nikkei weekly chart presented to members in our Yearly Forecast earlier this Year. You can see that we expected a decent pullback in the Instrument.
Nikkei Weekly Chart published at our Yearly Forecast
The Blue Box which you can see in the chart above. Is the 61.8% Extension area within a Bullish Grand Supercycle. That area was reached already earlier this year. Also in other Indices like the FTSE100, SPX or the Dow Jones YM reached their respective areas. Therefore, we knew that 2018 was about to be a tough year for the World Indices and we told members that will be like 2015 over again. We presented this comment to our members at the Yearly Forecast:
“Since bottoming in 2009, the rally in Nikkei from 2009 low shows a 5 swing sequence, favoring further upside. Nikkei has now reached the area of 23576 – 25643 where the fifth swing can end, and we are calling swing #5 ended at 24200. Nikkei is expected to pullback in the 6th swing in 3, 7, or 11 swing to correct the cycle from 2.2016 low. The expected correction in the 6th swing is similar in nature to the correction in 2013 (the 2nd swing correction) and then more upside in 7th swing. We don’t like selling Nikkei and prefer buying dips in 3-7-11 swing against 2.2016 low.”
Another quote in our Yearly Forecast stated the following:
“In conclusion, 2018 should be an interesting year for the Market, seeing the charts we can expected a temporary peak in the Indices. We believe the cycle from 2016 should be ending this year and a pull back like the one seen in 2013 should be seen before we get more upside in the Indices. Indices dips should find buyers in 3-7-11 swings against 2016 lows.”
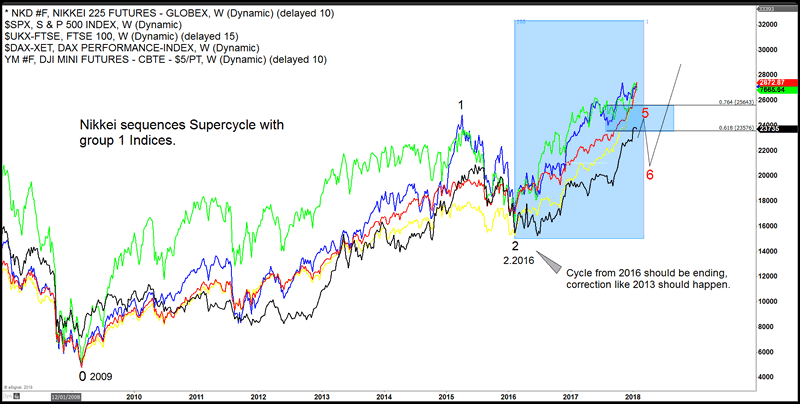
As you can see, we already warned our members of a temporary peak in 2018 and that a decent pullback should follow. The next chart represented the Nikkei sequences overlayed with others World Indices showing the expected Pullback.
Nikkei vs World Indices Weekly Chart

So as you can see, we already warned our members that the 2016 cycle was ending and a pullback was coming.
For us, it is very clear that the World Indices decline is very Technical and was expected overall. With that said the decline has nothing to do with interest rates, Political environment or Trade War. The decline is happening, because the World Indices reached the areas in which by Nature the Market pulls back. It was easy to see and expect.
The White House can come and try to spin the decline and show the positive face and facts but the reality is that Market Nature, sequences, cycles are still calling for more downside. Stocks like BABA and XOM are the important players now and they are presenting the floor for the Market again to rally. Those have the clearest structure.
Elliott Wave Theory counts can be adjusted in second. But Sequences cannot, and they work in higher perfection than the Theory itself. The Sequences are clear and we are waiting for BABA and XOM to reach their respective extreme areas. And once they reach their extreme. The World Indices should rally again because, they are all trading at same cycles, sequences and all are related to each other. Sequences and cycles rule the Market.
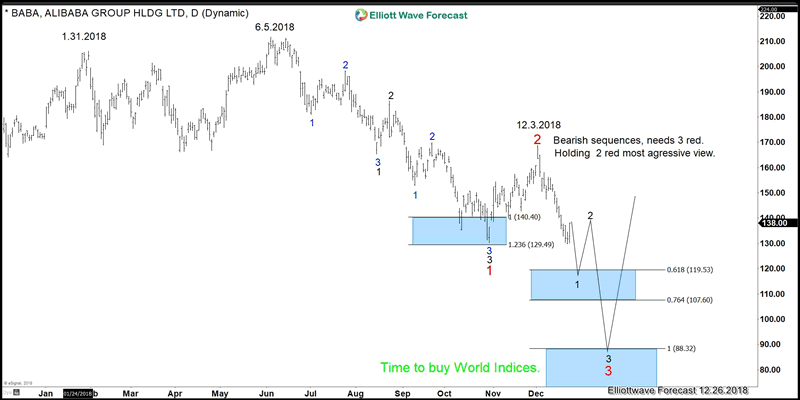
The following chart shows the BABA sequences from the 06/05/18 peak. This stock is supporting the idea of World Indices still trading lower against 12/3/18 peak.
BABA Daily Sequence Chart

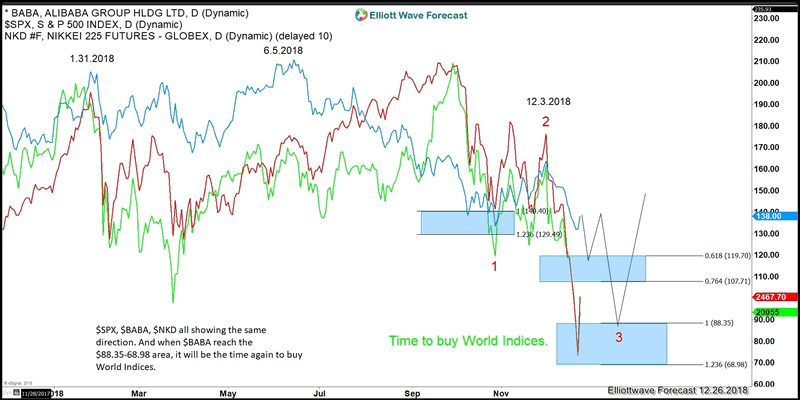
In the last chart you can see an overlay of SPX, BABA and the Nikkei Index. All are trading in the direction lower. And once BABA reached the 88.35-68.98 area (blue box) it will be yet the time again for us to buy the World Indices again.
SPX overlayed with BABA and Nikkei Daily Chart

We have learned over the Years to relate the Market with other correlating Instruments because that is the only way to get an edge. The Indices are not correcting the Grand Supercycle yet. They either have been correcting the 2016 cycle or the Supercycle. Anyway, they will offer us again a great opportunity to buy. Those whose are saying the economy is strong, they will be ending been right, because the sequences are supporting that fact. Stocks are having a very good price and the Grand Supercycle correction still need to wait. The chances that it is ending happening now is small, it can be seen through stocks like BAC because the stock would then go below zero which the chances are very small. We understand how the MARKET makers trade, so we follow them. And not the news events, Political world or Trade Wars. We at Elliott Wave Forecast trade like Smart Money.
By EWFEric
https://elliottwave-forecast.com
ElliottWave-Forecast has built its reputation on accurate technical analysis and a winning attitude. By successfully incorporating the Elliott Wave Theory with Market Correlation, Cycles, Proprietary Pivot System, we provide precise forecasts with up-to-date analysis for 52 instruments including Forex majors & crosses, Commodities and a number of Equity Indices from around the World. Our clients also have immediate access to our proprietary Actionable Trade Setups, Market Overview, 1 Hour, 4 Hour, Daily & Weekly Wave Counts. Weekend Webinar, Live Screen Sharing Sessions, Daily Technical Videos, Elliott Wave Setup .
Copyright © 2018 ElliottWave-Forecast - All Rights Reserved Disclaimer: The above is a matter of opinion provided for general information purposes only and is not intended as investment advice. Information and analysis above are derived from sources and utilising methods believed to be reliable, but we cannot accept responsibility for any losses you may incur as a result of this analysis. Individuals should consult with their personal financial advisors.
© 2005-2022 http://www.MarketOracle.co.uk - The Market Oracle is a FREE Daily Financial Markets Analysis & Forecasting online publication.


