


Silver Price Trend Forecast Target for 2019
Commodities / Gold & Silver 2019 Jan 10, 2019 - 02:42 PM GMTBy: Nadeem_Walayat

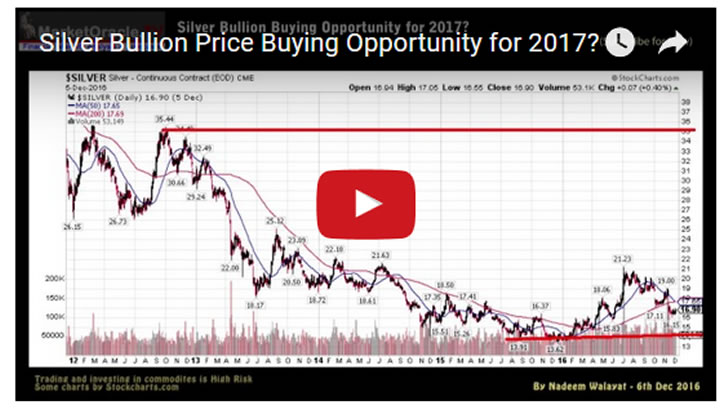
 My long standing approach to Silver is one of buying when cheap to invest and forget, for it only tends to come alive towards the end of precious metals bull runs as illustrated the last time I took a look at Silver on the 8th of May 2018 -
Silver Forecast 2018 and Beyond, Investing for the $35+ Price Spike!
In terms of a Silver market position then as is currently the case the silver market can usually be expected to be a dead market with the tendency to flat line not just for many months but even years as it tends to play second fiddle to Gold in terms of tradable swings, usually only really coming alive towards the latter stages of precious metal bull markets.
With the trend analysis in the accompanying video:
This analysis was first made available to Patrons who support my work.
So for immediate First Access to ALL of my analysis and trend forecasts then do consider becoming a Patron by supporting my work for just $3 per month. https://www.patreon.com/Nadeem_Walayat.
At that time Silver was stuck within a converging triangle where I expected the Silver price to ultimately breakout higher.
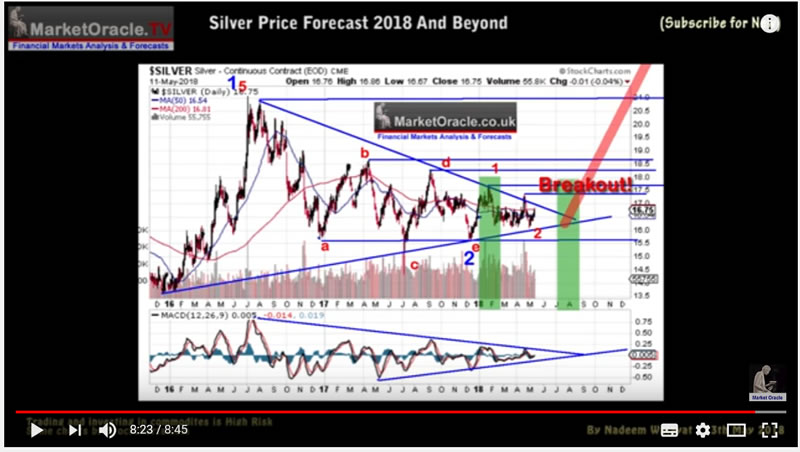
Well the Silver price did breakout higher, the only problem was that it proved to be a FALSE BREAKOUT. This illustrates the point that Silver in trend analysis terms is not that reliable i.e. technically Silver is a very messy market with dirty tops and bottoms, false breakouts in either directions which is why I approach Silver in terms of investing for spikes rather than trying to trade a trend.
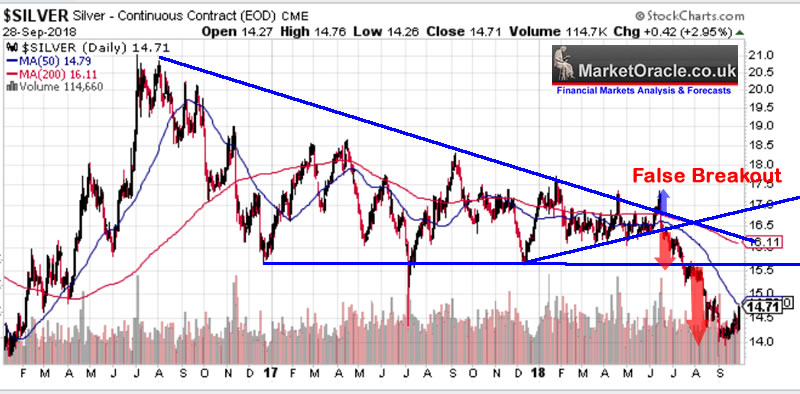
Which brings us to the present that looks set to see the Silver price end 2018 down about 15% on the year.
Gold - Silver Ratio
The Gold-Silver ratio is trading at an historic extreme of 85.27, at a level not seen for 25 years. In comparison the historic average is 50 which on the current Gold price of $1220 would have the Silver price trading at $24.40. However the ratio chart shows heavy support at around 67 which equates to a Silver price of $18.20 thus an achievable target for Silver in terms of its valuation against the Gold price, on successful achievement of which Silver could target a ratio of 50 ($24.40). So the Gold - Silver ratio is bullish for Silver suggesting that the Silver price 'should' at least target $18 during 2019.
Silver Long-Term Trend Analysis
Silver's long-term trend is that of a trading range between $21 and $12 pending a breakout higher that tends to culminate in spikes towards $50.
The current downtrend off of a high of $21.23 is targeting a trend towards support of $12-$14, that a decline to $13.86 achieved a few months ago. However there is no sign on the long-term chart for the Silver price coming alive any time soon i.e. it could continue to drift in the trading range of $18 to $12 for some years.
On the brightside the downside is limited to around $12, with greater upside potential of a trend to $21 on a breakout of which would target a spike to at least $35.
Also that the longer the silver price spends trading at low price levels then less investment in new supply (mining), thus sowing the seeds for a future price spike.
Silver Medium-Term Trend Analysis
The medium-term chart shows a series of lower highs in a trading range with a downwards bias, with a break lower in July taking the Silver price to its recent low of $13.86. With resistance at $15.50, $17 and $18.
Silver Short-Term Trend Analysis
The Silver price is clearly in a tight trading range of between $14 and $15. Where a breakout higher would target $16 and then $17.25. Whilst a break lower would target $13 and then $12. So again the upside potential is greater than the downside.
MACD - The MACD has unwound it's oversold state which implies that it's going to be decision time soon for Silver i.e. if it fails to break higher than it is likely to set a new trading low below $13.86.
Formulating a Trend Forecast
The silver price is in a trading range of between $15 and $14 as of September 2018 pending a breakout or breakdown. The problem is that the last trading range lasted for 1.5 years. Which means that the silver price could remain stuck in its current range for the whole of 2019. However, I don't see that as being the most probable outcome.
If the silver price breaks down then it would target $12. Whilst a breakout to the upside would target a trend to $18 and then $21.
Given the fact that Silver is in a tight trading range of just 1 buck, then it is probable that the Silver price for 2019 will resemble a messy wider trading range i.e. trades to new lows below $13.86, whilst also trading above $15 towards $18. Thus we could see Silver trade several times at $13 and $18, with a likely spike to $21 later in the year.
Silver Price Forecast Conclusion
Therefore my forecast conclusion is for the Silver price to trade in a volatile trading range with an upward bias towards a target of $21 later in 2019 which would represent a 42% gain on it's current price of $14.70. Whilst the spike to at least $35 remains as a longer term outlook.
Remember Silver is for Long-term INVESTING rather than to try and trade because it is a volatile messy market, so those attempting to trade Silver will likely keep getting stopped out.
How to Invest in Silver?
The easiest way to gain exposure to Silver is via the SLV ETF. Though remember your investing in a trust so the SLV trading price will not be the same as the Silver market price, but the SLV price trend usually does quite closely track the Silver price trend.
And ensure you are subscribed to this yourtube channel for new trend forecast videos.

This analysis was first been made available to Patrons who support my work.
So for immediate First Access to ALL of my analysis and trend forecasts then do consider becoming a Patron by supporting my work for just $3 per month. https://www.patreon.com/Nadeem_Walayat.
And ensure you are subscribed to my youtube channel.
Your analyst,
Nadeem Walayat
Copyright © 2005-2018 Marketoracle.co.uk (Market Oracle Ltd). All rights reserved.
Nadeem Walayat has over 30 years experience of trading derivatives, portfolio management and analysing the financial markets, including one of few who both anticipated and Beat the 1987 Crash. Nadeem's forward looking analysis focuses on UK inflation, economy, interest rates and housing market. He is the author of five ebook's in the The Inflation Mega-Trend and Stocks Stealth Bull Market series that can be downloaded for Free.


 Nadeem is the Editor of The Market Oracle, a FREE Daily Financial Markets Analysis & Forecasting online publication that presents in-depth analysis from over 1000 experienced analysts on a range of views of the probable direction of the financial markets, thus enabling our readers to arrive at an informed opinion on future market direction. http://www.marketoracle.co.uk
Disclaimer: The above is a matter of opinion provided for general information purposes only and is not intended as investment advice. Information and analysis above are derived from sources and utilising methods believed to be reliable, but we cannot accept responsibility for any trading losses you may incur as a result of this analysis. Individuals should consult with their personal financial advisors before engaging in any trading activities.
Nadeem Walayat Archive |
© 2005-2022 http://www.MarketOracle.co.uk - The Market Oracle is a FREE Daily Financial Markets Analysis & Forecasting online publication.