


Similarities Between Stock Market Today and Previous Bull Market Tops
Stock-Markets / Stock Markets 2019 Mar 23, 2019 - 09:13 PM GMTBy: Troy_Bombardia

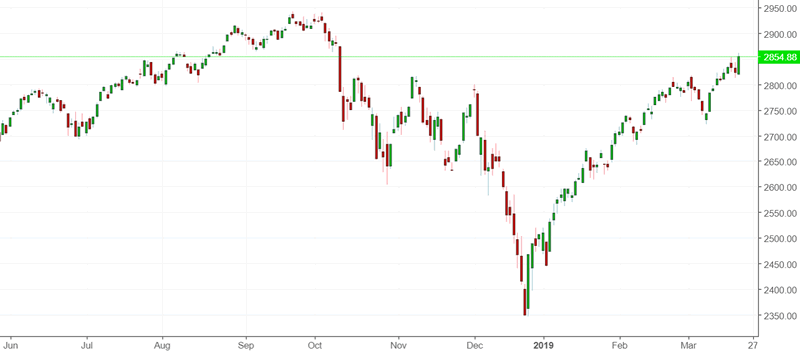
The stock market rally continues, with the S&P 500 now within 3% of its all-time highs. Meanwhile, various leading economic indicators are showing similarities to previous bull market tops.
Go here to understand our fundamentals-driven long term outlook.
Let’s determine the stock market’s most probable medium term direction by objectively quantifying technical analysis. For reference, here’s the random probability of the U.S. stock market going up on any given day.

*Probability ≠ certainty. Past performance ≠ future performance. But if you don’t use the past as a guide, you are blindly “guessing” the future.
Labor market
There’s usually a lot of hype in the finance industry, with most indicators blown out of proportion to demonstrate how bullish/bearish they are. I mostly try to dispell these beliefs and demonstrate that contrary to popular belief, XYZ indicator is not as bullish/bearish as you think.
But when there is something alarming, I do bring it up.
The labor market is extremely important when understanding the stock market’s long term direction. The economy & stock market move in the same direction in the long term. (Economy drives corporate earnings, which drives stocks).
When the labor market weakens, fewer people have money to spend, so they cut back spending, which is bad for corporate earnings, and the cycle becomes self-reinforcing.
The labor markets are “as good as they get” right now, so all the risk is to the downside. There are 3 key labor market indicators: the Unemployment Rate, Initial Claims, and Continued Claims.
Continued Claims has somewhat trended upwards over the past 6 months.
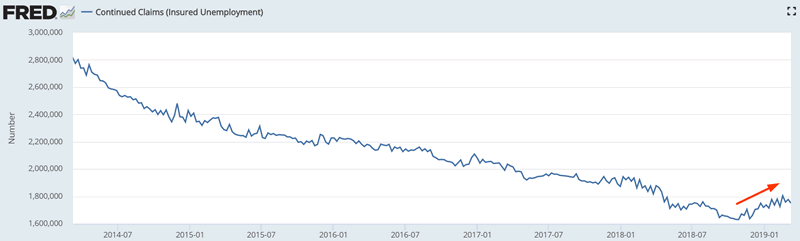
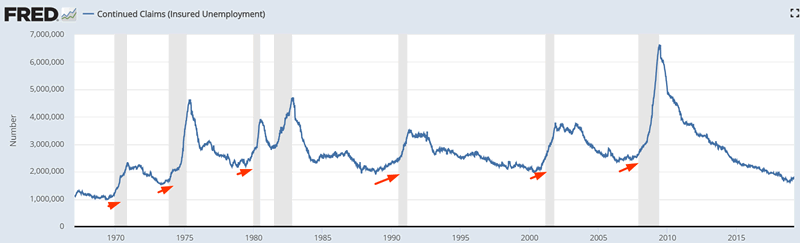
In the past, Continued Claims trended upwards from extremely low levels before bear markets and recessions began.
Here’s what happens next to the S&P 500 when Continued Claims’ 4 week moving average rises for at least 17 of the past 19 weeks.
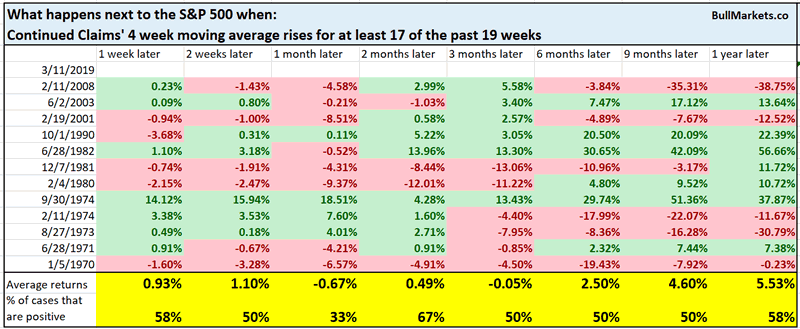
We can filter these cases to only look at the ones for which Unemployment was under 5% (i.e. late-cycle cases).
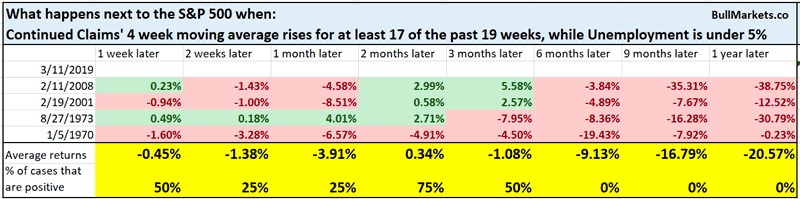
As you can see, this is how previous bear markets started.
Is this alarming? Yes. Right now, the only 2 things that truly worry me are housing and labor – 2 key leading indicators for the stock market.
NAHB weakness
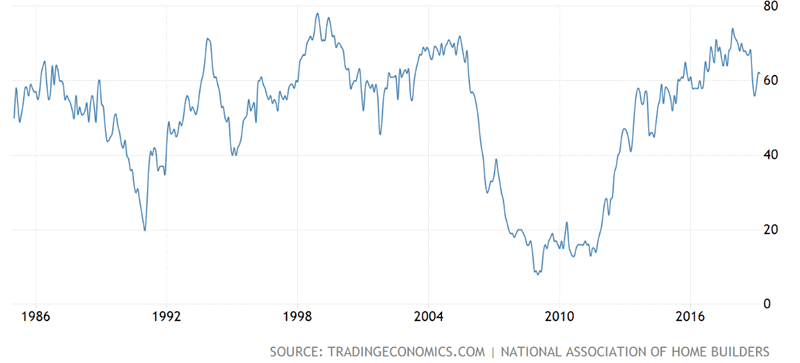
NAHB is a homebuilder index that gauges the state of the housing market. The latest reading for NAHB demonstrates that housing is still rather weak.
Here’s the NAHB Index plotted ontop of the S&P 500.
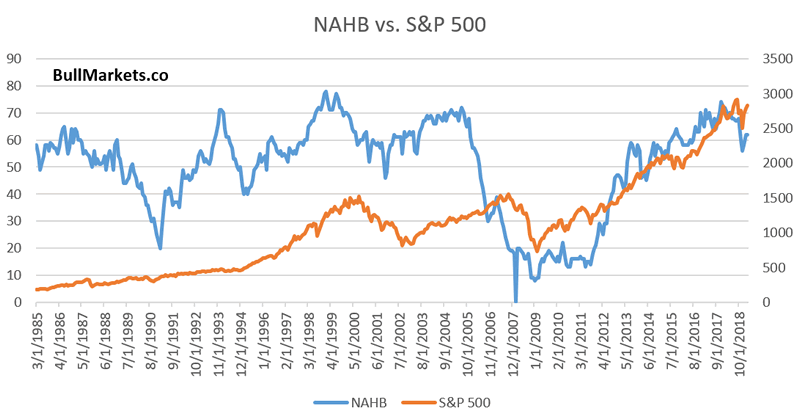
The NAHB Index has been below its 12 month moving average for 10 consecutive months.
*When looking at economic data, always look at the TREND.
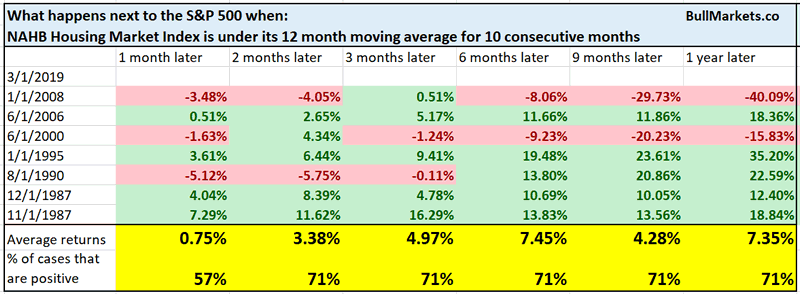
If we filter down for the late-cycle cases, we get 2006 and 2000.
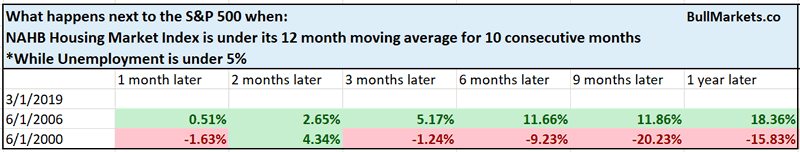
- 2000 in my mind represents a worst case scenario. I.e. the bull market’s top is already in.
- 2006 represents a best case scenario. I.e. contrary to everyone’s calls for a crash crash crash, the bull market still has 1-1.5 years left. The market frequently does what most people don’t expect, and with so many financial experts predicting a crash, it makes you wonder.
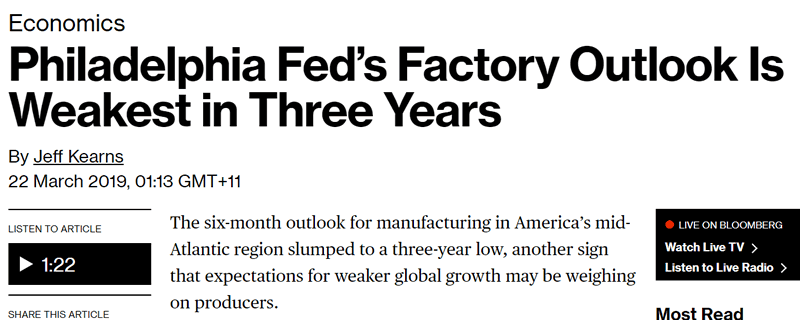
Factory outlook
Bloomberg reported that the Philadelphia Fed’s Factory Outlook is now the weakest in 3 years, since 2016.
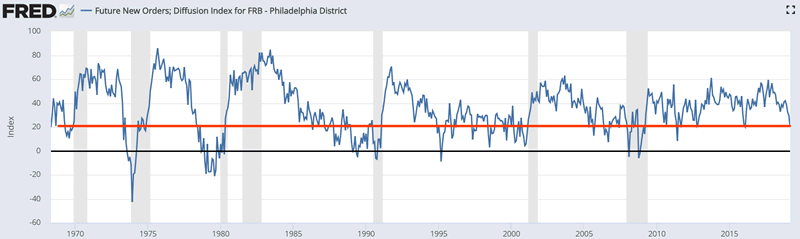
How bad is this? Here’s a longer term look at the data
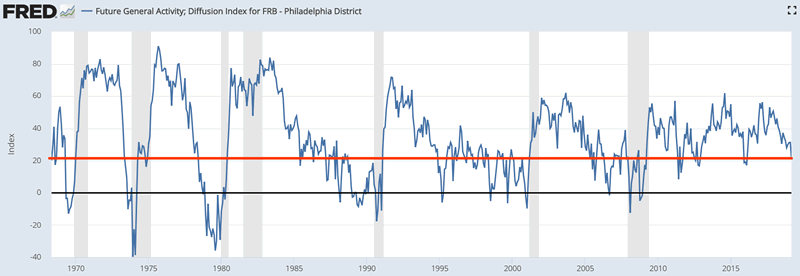
Here’s what happens next to the S&P 500 when the Future General Activity Index falls below 22.
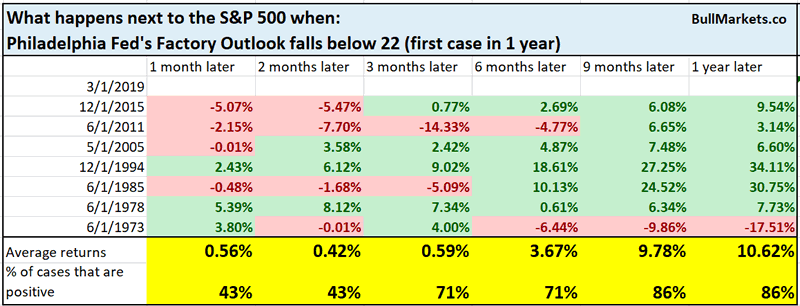
As you can see, the stock market’s future returns aren’t consistently bearish.
For a slightly more accurate bearish reading, it’s better to wait until the Future General Activity Index falls to zero.
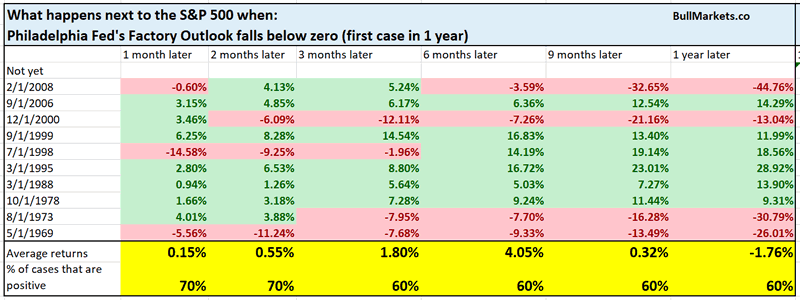
*This indicator is not as useful as the labor market and housing market indicators.
An interesting part of the yield curve
While most of the yield curve has been flattening, the 30 year – 5 year section of the yield curve has actually steepened. This is somewhat worrisome.
- A yield curve inversion is a warning sign for stocks, but not immediately bearish.
- A yield curve steepening is a bearish sign for stocks. (The yield curve typically steepens when the Fed cuts short term interest rates during an economic recession and bear market).
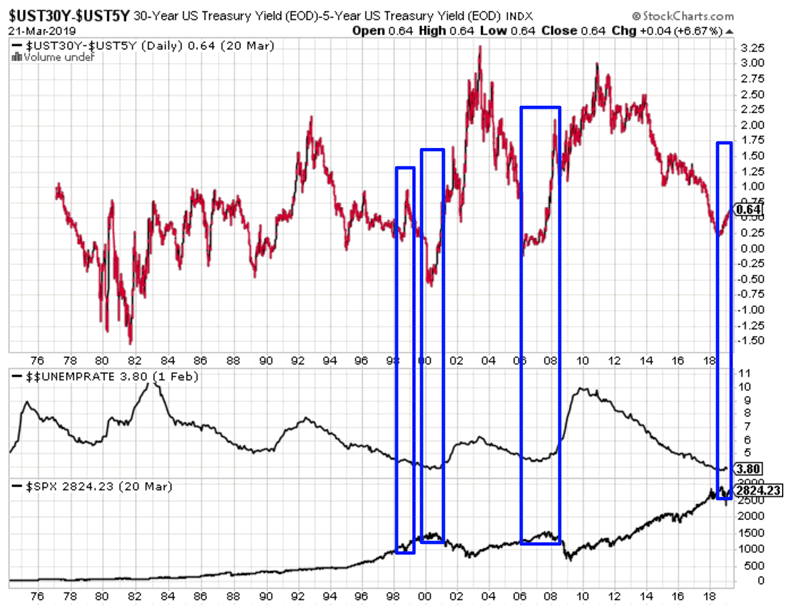
Here’s what happens next to the S&P 500 when the 30 year – 5 year yield curve steepened by 40 basis points over the past 9 months while the S&P rallies and Unemployment is under 5% (late-cycle cases).
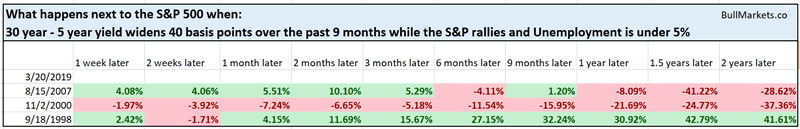
This happened in 1998, 2000, and 2007. Once again, I think 1998 represents a best case scenario. 1-1.5 years left of this bull market. Either way, think long term risk:reward
Finance stocks
The stock market’s rally over the past 3 months has been exceptionally friendly to holders of a traditional 60/40 portfolio (60% long stocks, 40% long bonds). Stocks are rising and interest rates are falling, which is good for bond prices.
But falling long term interest rates usually isn’t good for bank stocks. Banks borrow short term and lend long term, so when the yield curve flattens, banks’ profit margins shrink as well.
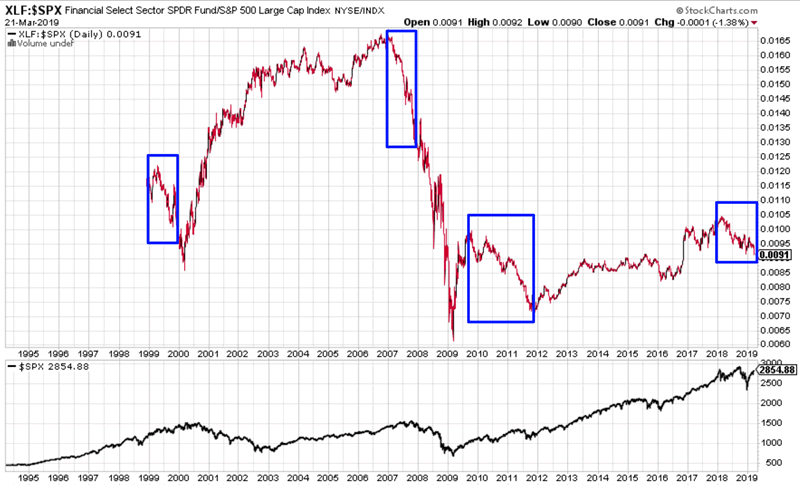
Perhaps this is why bank stocks have underperformed the S&P significantly during this rally. Here’s the XLY:SPX ratio (XLF = financial stocks ETF)
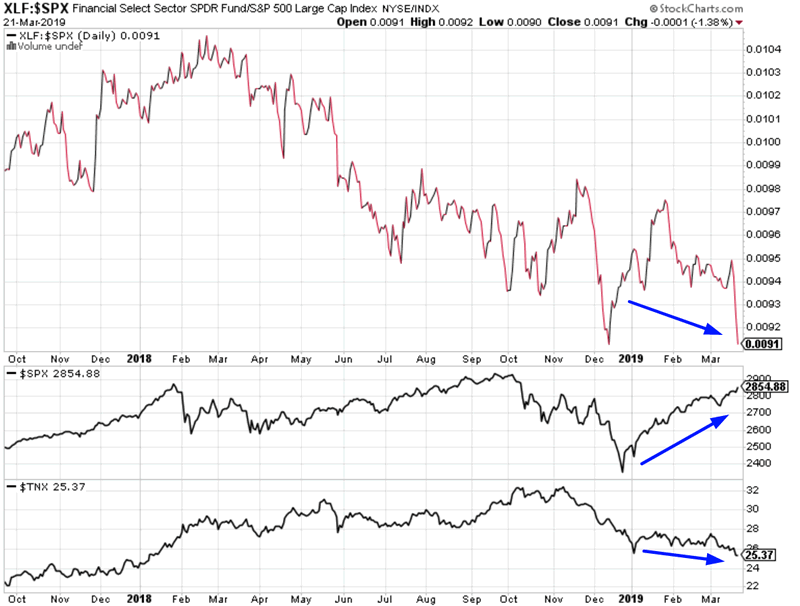
Seasoned traders will remember that this is similar to how the 2000 and 2007 bull market tops started. (But there were also false bearish signals from 2010-2012 and 2015-2016).
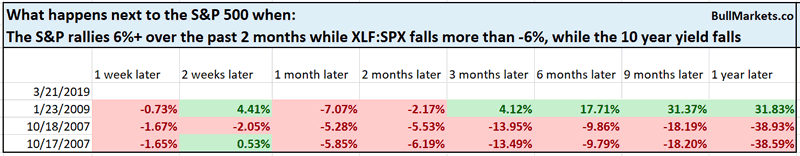
Here’s what happens next to the S&P when it rallies 6%+ over the past 2 months while finance underperforms because the 10 year yield falls.
Netflix and Apple
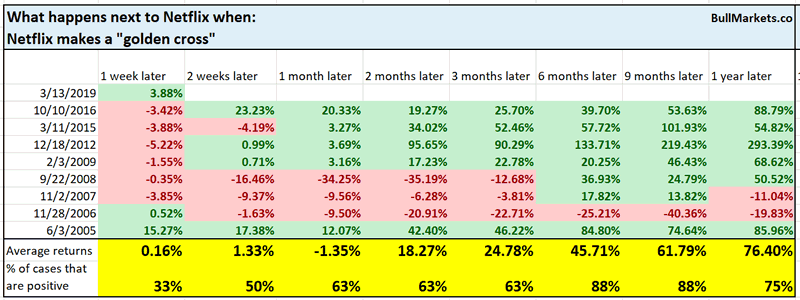
Here’s an interesting headline from CNBC
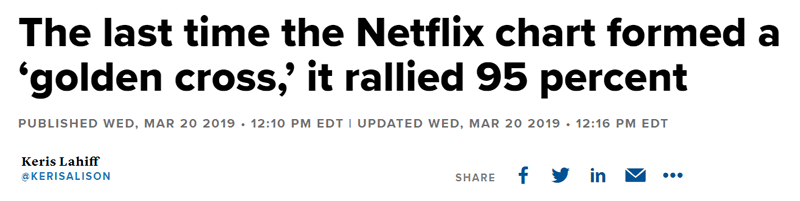
Before you jump up in excitment and think “YOU TOO can make 95% in a year with Netflix”, remember to be careful when someone tells you “the last time XYZ happened, the market soared/crashed”. That is usually a marketing gimmick used to trigger your recency bias and fear/greed complex.
Here’s every single golden cross for Netflix, and what Netflix did next.
Meanwhile, Apple broke out above its 200 dma today. Technical analysis books often preach “a market above its 200 dma is bullish and a market below its 200 dma is bearish”.
Here’s what happens when you buy Apple when it is above its 200 dma and sell when it falls below its 200 dma.
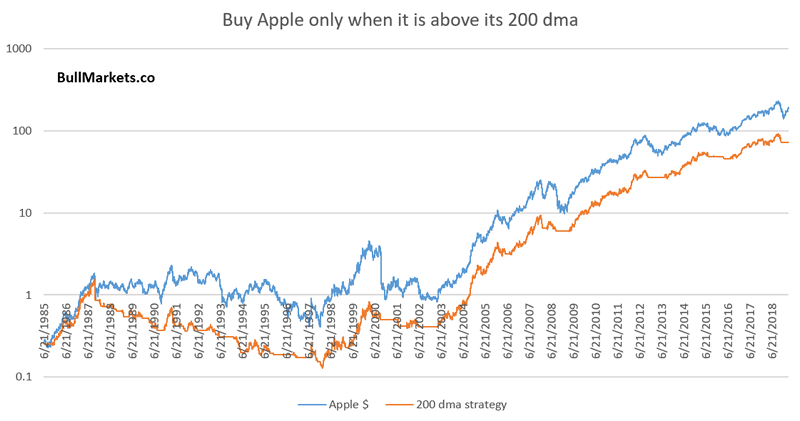
- From June 1985 – present: buy and hold Apple turns 25 cents into $195
- Using the 200 dma turns 25 cents into $75 (i.e. underperforms buy and hold)
Here’s what happens next to Apple when it closes above its 200 dma for the first time in 3 months.
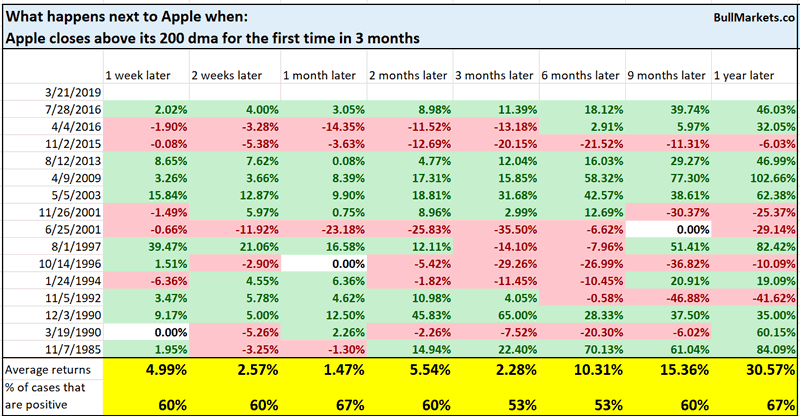
Once again, no different from random and buy and hold.
Click here for yesterday’s market analysis
Conclusion
Here is our discretionary market outlook:
- The U.S. stock market’s long term risk:reward is no longer bullish. In a most optimistic scenario, the bull market probably has 1 year left. Long term risk:reward is more important than trying to predict exact tops and bottoms.
- The medium term direction (e.g. next 6-9 months) is more bullish than bearish.
- The stock market’s short term has a bearish lean due to the large probability of a pullback/retest. Focus on the medium-long term (and especially the long term) because the short term is extremely hard to predict.
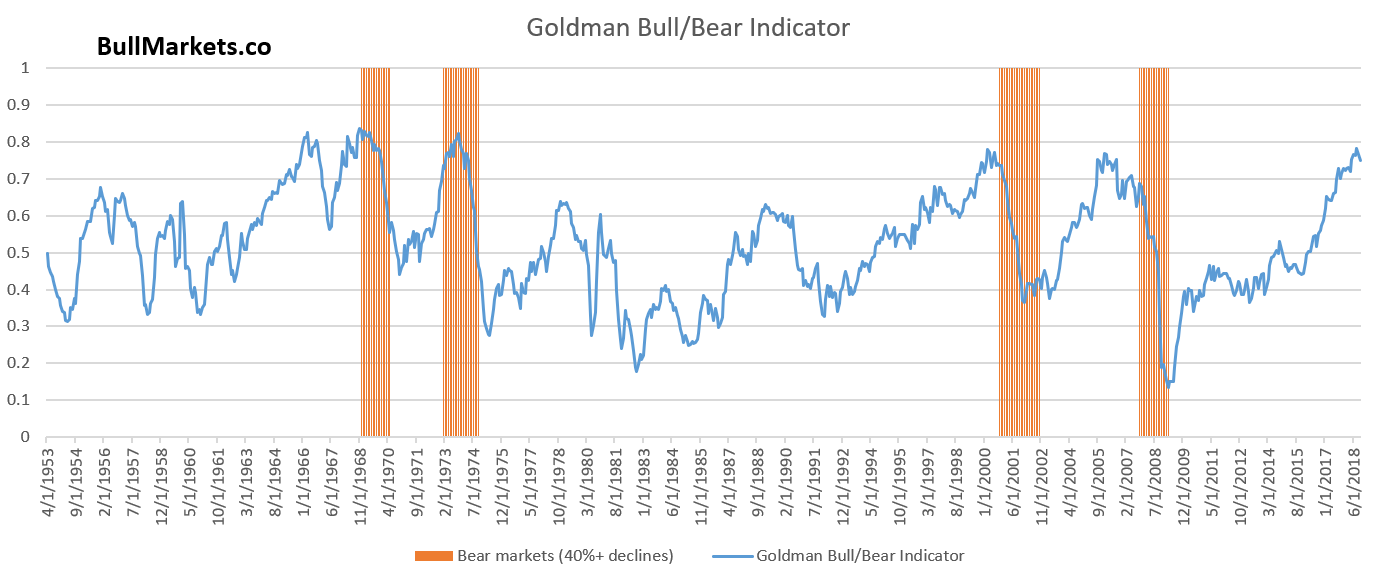
Goldman Sachs’ Bull/Bear Indicator demonstrates that while the bull market’s top isn’t necessarily in, risk:reward does favor long term bears.
Our discretionary outlook is not a reflection of how we’re trading the markets right now. We trade based on our quantitative trading models.
Members can see exactly how we’re trading the U.S. stock market right now based on our trading models.
Click here for more market studies
By Troy Bombardia
I’m Troy Bombardia, the author behind BullMarkets.co. I used to run a hedge fund, but closed it due to a major health scare. I am now enjoying life and simply investing/trading my own account. I focus on long term performance and ignore short term performance.
Copyright 2019 © Troy Bombardia - All Rights Reserved
Disclaimer: The above is a matter of opinion provided for general information purposes only and is not intended as investment advice. Information and analysis above are derived from sources and utilising methods believed to be reliable, but we cannot accept responsibility for any losses you may incur as a result of this analysis. Individuals should consult with their personal financial advisors.
© 2005-2022 http://www.MarketOracle.co.uk - The Market Oracle is a FREE Daily Financial Markets Analysis & Forecasting online publication.