


Costco Corp. (COST): Finding Opportunity in Five Minutes or Less
Companies / Company Chart Analysis May 24, 2019 - 05:38 PM GMTBy: EWI

Our FREE video shows how wave clarity is the first step to identifying a high-probability trade set-up.
Our chart of Costco Wholesale Corporation as of March 12. If today was March 12, could you assess within five minutes where this popular stock was headed next?
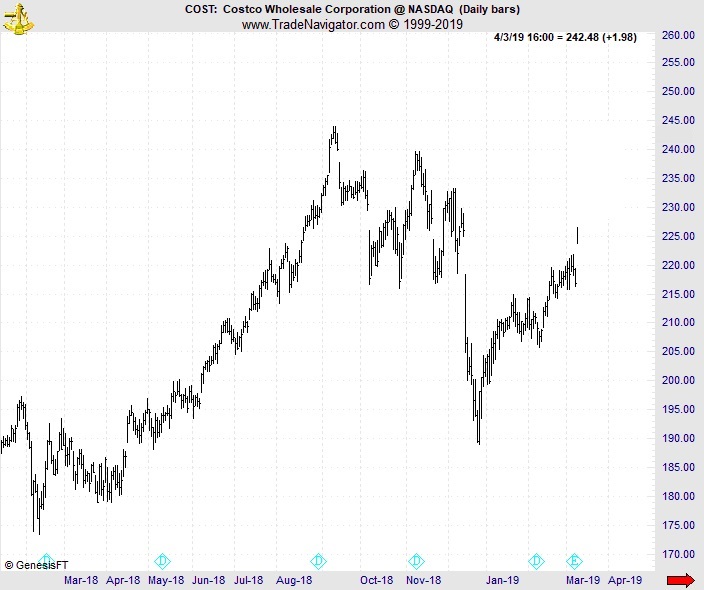
Maybe you'd go directly to a "news-based" analysis for guidance. There, you'd find conflicting reports about the company's future growth, as captured in these headlines from the time:
- Costco is Bearish: "Valuation Does Not Reflect the Risks: Costco" (March 11 monreport.com)
- Costco is Bullish: "Costco Stock is Still Rising After Earnings and It Has Room to Grow" (March 12 Barron's)
- Costco is back to being Bearish: "Why This Stock is Considered to Be Overbought? Costco Wholesale Corp." (March 11 Wall Street Morning)
After skimming those articles, you'd come away with zero new clarity about Costco's price trend.
Next, you try your hand at technical analysis, even Elliott wave analysis. You broaden your scope to include every relevant time frame, from weekly to hourly to even 1-minute charts -- all to determine where current price action fits in the larger structure.
And then... BEEP! Five minutes have passed but you haven't even begun to label the chart.
So, what's the lesson? That it's impossible to fully assess a market within five minutes?
No, just the opposite. As our Trader's Classroom editor Jeffrey Kennedy explains: The strongest market forecasts are got by with ease, alacrity, and clarity. In his March 12 Trader's Classroom video lesson "Tips on Counting Waves," Jeffrey offers this approach to analyzing price charts:
"Lean back, take a breath and relax. Look at the movement of prices. If the wave pattern isn't clear, don't trade it.
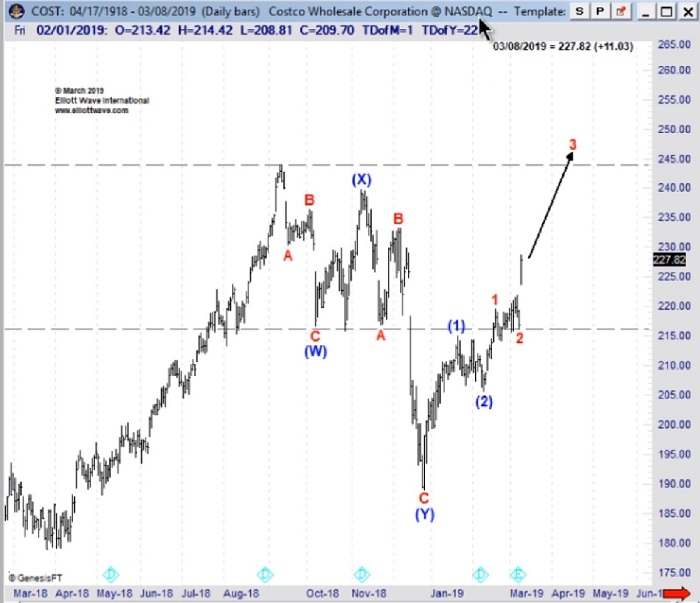
In his video lesson, Jeffrey puts his method to the test on the same price chart we just showed of Costco Wholesale Corporation. He pauses the video on the chart and identifies the most probable wave count, pictured below: a double zigzag A-B-C-X-A-B-C, followed by an impulsive set of one's and two's. The next move on hand was a powerful third wave rally. In Jeffrey's own words:
"If this wave count is correct, we will continue to see prices moving higher, ultimately beyond the high of 243.92. I think this is a very solid interpretation and I hope you label the price chart as such."
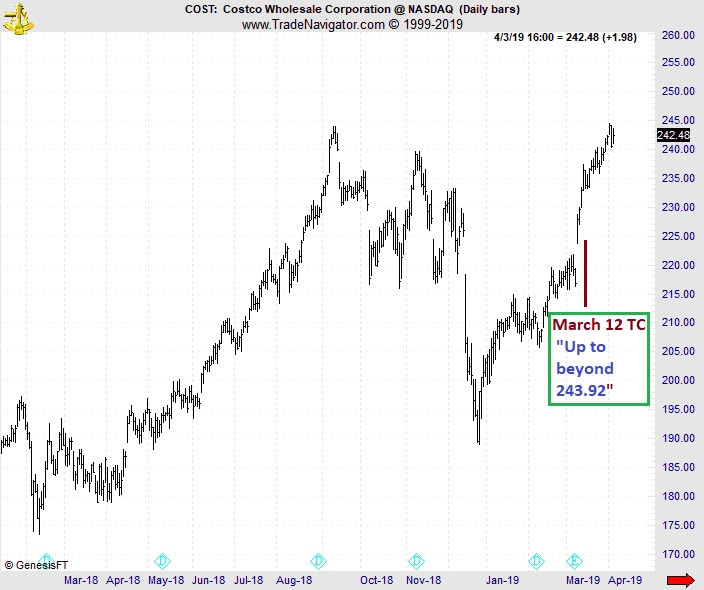
In all, Jeffrey's analysis, labeling and forecast took four minutes! And, as the next chart shows, Costco followed Jeffrey's outlook to a T, with shares soaring "beyond the high of 243.92" to a fresh record on April 1.
In his 25 years of studying and teaching Elliott wave analysis, Jeffrey observes that 60-80% of market price action unfolds in five core Elliott wave patterns. These patterns are clear, and don't require an in-depth understanding of wave machinations -- all which eat traders' precious time.
Jeffrey's March 12 Trader's Classroom video "Tips on Counting Waves" shows you exactly how to identify these core patterns on the price charts of real, household name stocks -- including today's Costco example. The other markets are: WPX Energy, Inc (WPX), Dow DuPont, Inc (DWDP), Citrix Systems, Inc (CTXS), and Bank of America Corp. (BAC).
Right now, Club EWI members can have instant, no-cost access to Jeffrey's "Tips on Counting Waves" video lesson via a new Club resource titled "Discover 5 Reliable Setups in Just 26 Minutes." Get your free lesson now..
This article was syndicated by Elliott Wave International and was originally published under the headline Costco Corp. (COST): Finding Opportunity in Five Minutes or Less. EWI is the world's largest market forecasting firm. Its staff of full-time analysts led by Chartered Market Technician Robert Prechter provides 24-hour-a-day market analysis to institutional and private investors around the world.
EWI is the world's largest independent technical analysis firm. Founded by Robert Prechter in 1979, EWI helps investors and traders to catch market opportunities and avoid potential pitfalls before others even see them coming. Their unique perspective and high-quality analysis have been their calling card for nearly 40 years, featured in financial news outlets such as Fox Business, CNBC, Reuters, MarketWatch and Bloomberg.
© 2005-2022 http://www.MarketOracle.co.uk - The Market Oracle is a FREE Daily Financial Markets Analysis & Forecasting online publication.