


The US Dollar’s Subtle Message for Gold
Currencies / US Dollar Feb 11, 2020 - 06:48 PM GMTBy: P_Radomski_CFA

Gold and the US dollar. The yellow metal and its fiat nemesis. Often, they move inversely, though the strength and even the direction of their relationship varies when examined from different time perspectives. What is the message the greenback is sending out currently?
The USD Index is moving up in a rising trend channel (all medium-term highs are higher than the preceding ones) that formed after the index ended a very sharp rally. This means that the price movement within the rising trend channel is actually a running correction, which is the most bullish type of correction out there. If a market declines a lot after rallying, it means that the bears are strong. If it declines a little, it means that bears are only moderately strong. If the price moves sideways instead of declining, it means that the bears are weak. And the USD Index didn’t even manage to move sideways. The bears are so weak, and the bulls are so strong that the only thing that the USD Index managed to do despite Fed’s very dovish turn and Trump’s calls for lower USD, is to still rally, but at a slower pace.
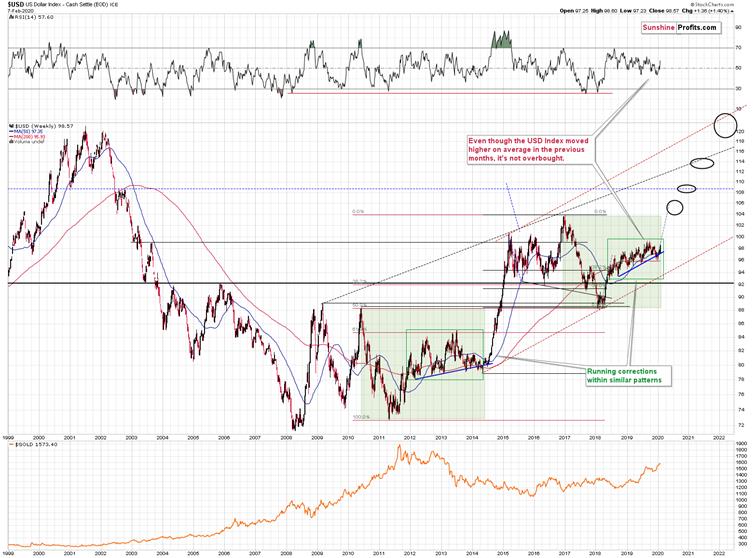
The temporary breakdown below the rising blue support line was invalidated. That’s a technical sign that a medium-term bottom is already in.
Interestingly, that’s not the only medium-term running correction that we saw. What’s particularly interesting is that this pattern took place between 2012 and 2014 and it was preceded by the same kind of decline and initial rebound as the current running correction.
The 2010 – 2011 slide was very big and sharp, and it included one big corrective upswing – the same was the case with the 2017 – 2018 decline. They also both took about a year. The initial rebound (late 2011 and mid-2018) was sharp in both cases and then the USD Index started to move back and forth with higher short-term highs and higher short-term lows. In other words, it entered a running correction.
The blue support lines are based on short-term lows and since these lows were formed at higher levels, the lines are ascending. We recently saw a small breakdown below this line that was just invalidated. And the same thing happened in early 2014. The small breakdown below the rising support line was invalidated.
Since there were so many similarities between these two cases, the odds are that the follow-up action will also be similar. And back in 2014, we saw the biggest short-term rally of the past 20+ years. Yes, it was bigger even than the 2008 rally. The USD Index soared by about 21 index points from the fakedown low.
The USDX formed the recent fakedown low at about 96. If it repeated its 2014 performance, it would rally to about 117 in less than a year. Before shrugging it off as impossible, please note that this is based on a real analogy – it already happened in the past.
Based on what we wrote previously in today’s analysis, you already know that big rallies in the USD Index are likely to correspond to big declines in gold. The implications are, therefore, extremely bearish for the precious metals market in the following months.
On a short-term basis, the USD Index is likely to correct as no market can move in a straight line indefinitely.
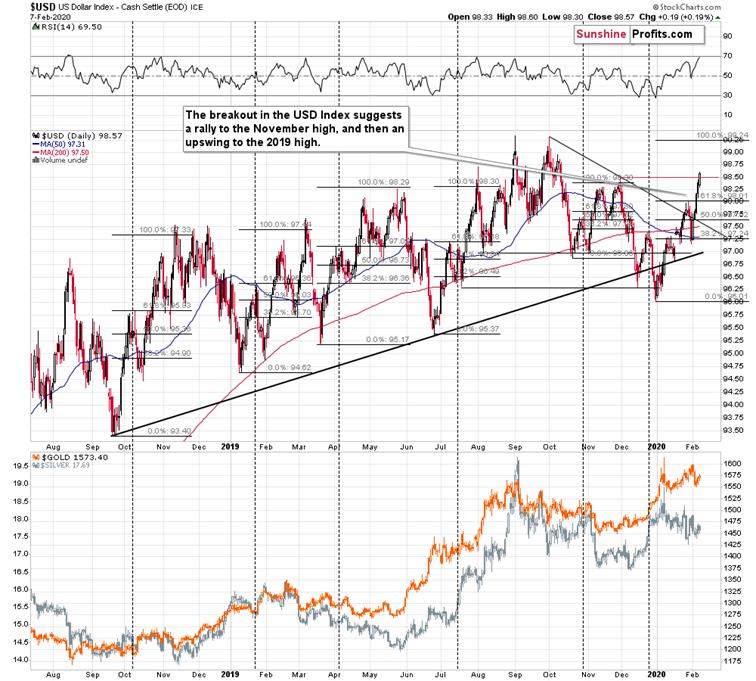
And it’s likely to correct relatively soon. The USD Index broke above its declining resistance line and moved to new yearly highs. The USD Index moved even a bit above it November 2019 high, but the breakout is not yet confirmed. Given the RSI at about 70, we doubt that it will be confirmed. While the unconfirmed breakout is still a bullish factor, the odds are that the USDX will decline in the short run anyway.
Now, based on the recent local high (the one that was just broken), we can estimate how high the USD Index is likely to move in the next few weeks. This can be done thanks to the Fibonacci extensions technique. In short, it means multiplying the size of the previous rally by 1.618.
In practice, we can do it by using the Fibonacci… retracement tool, but drawing it in a way that anchors the start of the retracement at the initial bottom, and then placing the 61.8% Fibonacci retracement at the initial top. The 100% “retracement” now points to the target. Why would the “retracement” work in this way? Because 100% / 61.8% = 1.618 (approximately) That’s one of the very specific properties of the Phi number. Other include that 1 / 0.618^2 = 2.618 (approximately) and many more.
But the math behind it is not that important – what is important is that it very often works.
In all cases that we marked on the above chart, this technique pointed to important short-term tops. Currently, it points to a top being likely at about 99.24. This is the 2019 high, which makes this level very likely to stop the USD Index… for some time. After all, the USD Index is in a powerful uptrend – it’s likely to exceed its previous highs despite short-term pullbacks.
Still, the USD Index might not rally to the 2019 high without an intermediate correction. Please note what happened in the cases that we applied the Fibonacci extension to. In all cases, except for the July rally, the USD Index first formed an initial high, corrected, and only then moved to the Fibonacci-extension-based target.
The November high is the next strong (from the short-term point of view) resistance and it’s confirmed also by a short-term inverse head-and-shoulders pattern. This high was already reached.
So, while the USD Index is still likely to move lower in the following days, the precious metals are likely to move higher. The opposite is likely in the following months.
Thank you for reading the above free analysis. It’s part of today’s extensive Gold & Silver Trading Alert. We encourage you to sign up for our free gold newsletter – as soon as you do, you'll get 7 days of free access to our premium daily Gold & Silver Trading Alerts and you can read the full version of the above analysis right away. Sign up for our free gold newsletter today!
Thank you.
Przemyslaw Radomski, CFA
Founder, Editor-in-chief
Tools for Effective Gold & Silver Investments - SunshineProfits.com
Tools für Effektives Gold- und Silber-Investment - SunshineProfits.DE
* * * * *
About Sunshine Profits
Sunshine Profits enables anyone to forecast market changes with a level of accuracy that was once only available to closed-door institutions. It provides free trial access to its best investment tools (including lists of best gold stocks and best silver stocks), proprietary gold & silver indicators, buy & sell signals, weekly newsletter, and more. Seeing is believing.
Disclaimer
All essays, research and information found above represent analyses and opinions of Przemyslaw Radomski, CFA and Sunshine Profits' associates only. As such, it may prove wrong and be a subject to change without notice. Opinions and analyses were based on data available to authors of respective essays at the time of writing. Although the information provided above is based on careful research and sources that are believed to be accurate, Przemyslaw Radomski, CFA and his associates do not guarantee the accuracy or thoroughness of the data or information reported. The opinions published above are neither an offer nor a recommendation to purchase or sell any securities. Mr. Radomski is not a Registered Securities Advisor. By reading Przemyslaw Radomski's, CFA reports you fully agree that he will not be held responsible or liable for any decisions you make regarding any information provided in these reports. Investing, trading and speculation in any financial markets may involve high risk of loss. Przemyslaw Radomski, CFA, Sunshine Profits' employees and affiliates as well as members of their families may have a short or long position in any securities, including those mentioned in any of the reports or essays, and may make additional purchases and/or sales of those securities without notice.
Przemyslaw Radomski Archive |
© 2005-2022 http://www.MarketOracle.co.uk - The Market Oracle is a FREE Daily Financial Markets Analysis & Forecasting online publication.