


How To Spot The End Of An Excess Market Trend Phase – Part II
InvestorEducation / Learn to Trade Nov 28, 2020 - 05:21 PM GMTBy: Chris_Vermeulen

In Part I of this research article, my research team and I highlighted the five unique components of an Excess Phase peak and breakdown process. We are sharing this data with you because we believe the US stock market has already meandered 2.5 years past the end of a US Stock Market Appreciation phase and is well into an Excess Phase Peaking process. This becomes very important for traders because risks are much higher in these late Excess Phase stages because volatility is usually 4x to 6x higher than previous phases. Additionally, psychologically, many traders want the rally to continue and deeply believe the end of this phase is “just a pullback in a bigger trend”. This can be very dangerous as traders sometimes continue to buy into deeper price corrections – leveraging their accounts to the hilt thinking “they are going to make a killing when the rally resumes”.
EXPLORING PAST EXCESS PHASE PEAK/BREAKDOWN EVENTS
Excess Phases and Blow-Off Peaks/Bottoms can become very addictive for certain people – especially those that have gotten into the trend before the Excess Phase began. These people are often “die-hard” believers that the trend will never stop rallying and can sometimes leverage themselves into very dangerous positions.
If you recall from the first part of this research article, there are five phases to the Excess Phase price decline and we believe each of these five phases is fairly common for all excess phase breakdowns:
- The Excess Phase Rally must push price levels to new highs.
- A breakdown in price from the Excess Phase Peak sets up a FLAG/Pennant recovery phase. This represents the first attempt at a recovery that eventually fails
- A breakdown in price from the FLAG/Pennant price recovery phase creates the real first opportunity for short traders or those that executed timely Put options. This represents the first real downward price trend after the FLAG setup.
- Phase 3 sets up the Intermediate-term support level. This becomes the last line of defense for price – an intermediate-term price floor. This phase can take quite a while to complete as traders often still believe a new rally will resume – thus, this support level often has quite a bit of momentum to breakdown before it eventually fails.
- The final breakdown of price below the Phase 4 support level usually begins a much deeper sell-off. This is usually when other factors in the markets have finally resulted in the realization that the excess phase is over.
Before you continue, be sure to opt-in to our free market trend signals before closing this page, so you don’t miss our next special report!
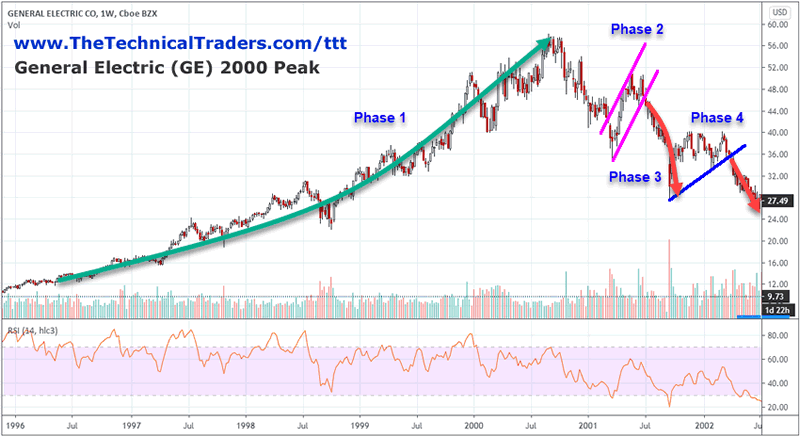
The following Weekly General Electric chart from 2000 clearly illustrates the five phases of the Excess Breakdown event. Notice how deep the initial breakdown in price was from the peak in late 2000 to the initial FLAG formation (Phase 2). Additionally, pay attention to how deep price actually fell throughout the peak to Phase 4 end. From a peak price level near $58 to a low price level near $36 – this represents 38% price decline. Phases 3 & 4 represent the last defense of price near a support level before continued selling drives price levels lower. GE price levels eventually fell to levels near $20.50 in 2003 from these peaks. An almost identical Excess Phase peak setup in 2007, which resulted in a breakdown in price from $40.36 to $5.50 – representing a whopping 86% decline.
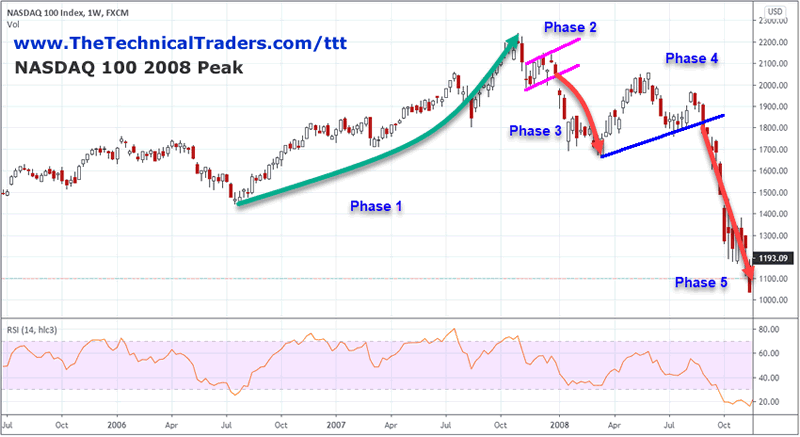
This next example of the NASDAQ peak in 2007 shows a similar, yet tighter, Excess Phase breakdown event. Notice that all five components are clearly visible in this example as well. Initially, the Excess Phase rally reached a new price peak, then a very quick breakdown in price setup the Phase 2 FLAG setup. A large GAP breakdown ended the FLAG setup and prompted the Phase 3 price decline. This decline set up the Phase 4 extended support phase which acts as the “last line of defense” for price. Eventually, that support level was breached and the NASDAQ price levels began to decline very rapidly.
After the January 2018 collapse in price, we published articles suggesting the markets would recover fairly quickly and push to new highs, accurately predicting the recovery after the October 2018 collapse. In August 2019, we issued a “Super-Cycle warning” suggesting everyone take immediate action to protect assets/capital. On February 21, 2020, we issued our “Black Swan Warning” suggesting everyone take immediate action to protect assets/capital related to the COVID-19/Global Markets event. Recently, on September 12, 2020, we issued our “Grey Swan Warning” suggesting that an Excess Phase peak was very near and that we may begin to see extreme volatility and downside price trends.
If our research is correct, we believe we are very close to an end-of-year Excess Phase “Blow-off” peak in the US stock markets and may begin to setup these five phases of the Excess Phase Breakdown. If you want to stay ahead of the markets then sign up today to the Technical Trader newsletter for our daily pre-market reports walking you through the charts of the major asset classes. Let us help you protect your capital while identifying great trading opportunities!
Chris Vermeulen
www.TheTechnicalTraders.com
Chris Vermeulen has been involved in the markets since 1997 and is the founder of Technical Traders Ltd. He is an internationally recognized technical analyst, trader, and is the author of the book: 7 Steps to Win With Logic
Through years of research, trading and helping individual traders around the world. He learned that many traders have great trading ideas, but they lack one thing, they struggle to execute trades in a systematic way for consistent results. Chris helps educate traders with a three-hour video course that can change your trading results for the better.
His mission is to help his clients boost their trading performance while reducing market exposure and portfolio volatility.
He is a regular speaker on HoweStreet.com, and the FinancialSurvivorNetwork radio shows. Chris was also featured on the cover of AmalgaTrader Magazine, and contributes articles to several leading financial hubs like MarketOracle.co.uk
Disclaimer: Nothing in this report should be construed as a solicitation to buy or sell any securities mentioned. Technical Traders Ltd., its owners and the author of this report are not registered broker-dealers or financial advisors. Before investing in any securities, you should consult with your financial advisor and a registered broker-dealer. Never make an investment based solely on what you read in an online or printed report, including this report, especially if the investment involves a small, thinly-traded company that isn’t well known. Technical Traders Ltd. and the author of this report has been paid by Cardiff Energy Corp. In addition, the author owns shares of Cardiff Energy Corp. and would also benefit from volume and price appreciation of its stock. The information provided here within should not be construed as a financial analysis but rather as an advertisement. The author’s views and opinions regarding the companies featured in reports are his own views and are based on information that he has researched independently and has received, which the author assumes to be reliable. Technical Traders Ltd. and the author of this report do not guarantee the accuracy, completeness, or usefulness of any content of this report, nor its fitness for any particular purpose. Lastly, the author does not guarantee that any of the companies mentioned in the reports will perform as expected, and any comparisons made to other companies may not be valid or come into effect.
Chris Vermeulen Archive |
© 2005-2022 http://www.MarketOracle.co.uk - The Market Oracle is a FREE Daily Financial Markets Analysis & Forecasting online publication.