


Stock Market Rally On – Price Range Continues To Narrow As Reflation Trade Flags Out
Stock-Markets / Stock Market 2021 Aug 26, 2021 - 12:07 PM GMTBy: Chris_Vermeulen

After a week of moderate volatility, while Consumer Sentiment and other economic data surprised traders/investors, the US markets entered a strong rally phase early in trading on Monday, August 23, 2021. This suggests traders continue to buy the dips in expectation of a never-ending rally trend.
Bucking Consumer Sentiment Trends
While the US markets continue to trend higher, some of our custom indicators and modeling systems have recently warned of market weakness setting up in cross-market sectors. Additionally, last week, the foreign markets took a bit of a beating while general commodities moved decidedly lower. Overall, it is tough to argue with this upward price trend – even while other indicators suggest intermediate market strength may be weakening.
Be sure to sign up for our free market trend analysis and signals now so you don’t miss our next special report!
As we are starting to move into the end of August and closing in on the end of Q3:2021, we should start to determine how traders and investors will perceive the opportunities of the reflation rally trend carrying into Q4:2021 – possibly leading the Christmas Rally into the biggest market rally we’ve seen in decades.
2021 has already seen more upward price trending and more Federal Reserve support for the US stock market at any time in history. I believe the US Federal Reserve has poured more than $4 Trillion into the US and global markets over the past 15+ months (since COVID). This is well more than double the amount of capital poured into the US economy after the 2008-09 Housing Market Crash.
When and How does it end? It’s anyone’s guess at this point. But we are confident the extended flagging formation on these charts suggests the US markets are nearing an Apex level that may prompt very big volatility ranges in price.
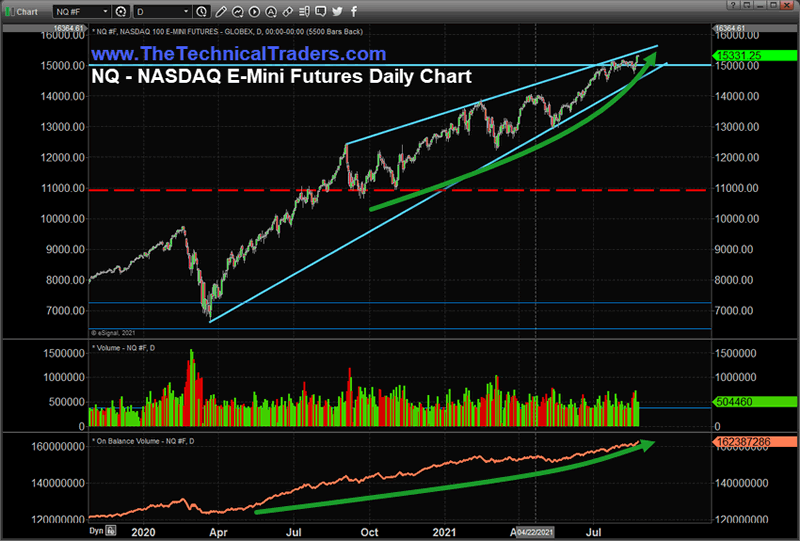
NASDAQ Rallies Above $15,300 On Strong Momentum
The rally in the NASDAQ on August 23, 2021, was quite a sight to see. After moderate price volatility the week before and with the foreign markets under some pressure, it appears the focus on the US market strength, and particularly the Technology/Biotech Sector strength, pushed the NASDAQ even higher.
Our researchers believe we are very near to an Apex in this Pennant/Flag formation that may lead to extended volatility over the September/October months. We need to see how the consumer engages in the economy as the extended COVID restrictions kick in. We believe the US economic environment is very fluid right now – and possibly moving very quickly as expectations change.
SPY Parties Onto New Highs Again
One interesting component of this rally is that we are seeing a combination of Housing market strength as well as Technology/Biotech strength. Streaming services and the transition to work-from-home seems to have shifted how people are spending their incomes.
I was mentioning to a friend how we saw what happened in the late 1990s with the DOT COM/Technology bubble. Then we saw what happened in 2008-09 with easy money policies driving a housing/credit boom cycle that burst. Now, we have both of these events driving the current bubble in the markets. Both Housing and Technology are sparking an incredible rally phase after COVID that may still continue for many months – possibly through the end of 2021 and into 2022.
This SPY Daily Chart highlights the incredible strength and building OBV that seems to be supporting the upward trends. It appears more and more traders are pouring into the long side of this trend – building bigger and bigger positions over time. If a big volatility event does take place, many of these traders/investors will be scrambling for protection.
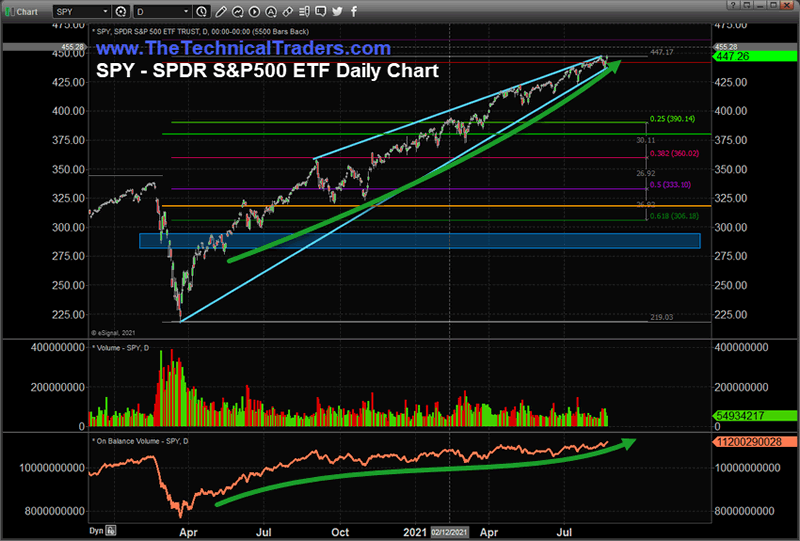
Many months ago I wrote about how the $440 (SPY) and $4400 (S&P500) may become major resistance. As price has rallied above these levels now, these levels may turn into support.
I’m still expecting volatility in the markets as we transition into the new post COVID world and as consumers address shifting targets related to work, community, activities, and the pending winter season. The tightening range of these Pennant/Flag formations suggests the markets are nearing an Apex level. Traders and investors should stay keenly aware of how this price range (Flag) continues to extend. At some point in the very near future, a big breakout/breakdown event is very likely to take place.
More than ever, right now, traders need to move away from risk functions and start using common sense. There will still be endless opportunities for profits from these extended price rotations, but the volatility and leverage factors will increase risk levels for traders that are not prepared or don’t have solid strategies. Don’t let yourself get caught in these next cycle phases unprepared.
Please take a minute to learn about my BAN Trader Pro newsletter service and how it can help you identify and trade better sector setups. My team and I have built this strategy to help us identify the strongest and best trade setups in any market sector. Every day, we deliver these setups to our subscribers along with the BAN Trader Pro system trades. You owe it to yourself to see how simple it is to trade 30% to 40% of the time to generate incredible results.
For those of you who are interested in Options Trading, our resident specialist Neil Szczepanski will be hosting a LIVE two-part Intermediate Course beginning on Wednesday, August 25, 2021. Neil will dive deep into the different strategies and outline what are the best trade setups and what to avoid – helping you to become a more knowledgable, confident, and advanced options trader. To learn more, or to register for the course, kindly click on the following link: INTERMEDIATE OPTIONS MENTORING COURSE.
Have a great day!
Chris Vermeulen
www.TheTechnicalTraders.com
Chris Vermeulen has been involved in the markets since 1997 and is the founder of Technical Traders Ltd. He is an internationally recognized technical analyst, trader, and is the author of the book: 7 Steps to Win With Logic
Through years of research, trading and helping individual traders around the world. He learned that many traders have great trading ideas, but they lack one thing, they struggle to execute trades in a systematic way for consistent results. Chris helps educate traders with a three-hour video course that can change your trading results for the better.
His mission is to help his clients boost their trading performance while reducing market exposure and portfolio volatility.
He is a regular speaker on HoweStreet.com, and the FinancialSurvivorNetwork radio shows. Chris was also featured on the cover of AmalgaTrader Magazine, and contributes articles to several leading financial hubs like MarketOracle.co.uk
Disclaimer: Nothing in this report should be construed as a solicitation to buy or sell any securities mentioned. Technical Traders Ltd., its owners and the author of this report are not registered broker-dealers or financial advisors. Before investing in any securities, you should consult with your financial advisor and a registered broker-dealer. Never make an investment based solely on what you read in an online or printed report, including this report, especially if the investment involves a small, thinly-traded company that isn’t well known. Technical Traders Ltd. and the author of this report has been paid by Cardiff Energy Corp. In addition, the author owns shares of Cardiff Energy Corp. and would also benefit from volume and price appreciation of its stock. The information provided here within should not be construed as a financial analysis but rather as an advertisement. The author’s views and opinions regarding the companies featured in reports are his own views and are based on information that he has researched independently and has received, which the author assumes to be reliable. Technical Traders Ltd. and the author of this report do not guarantee the accuracy, completeness, or usefulness of any content of this report, nor its fitness for any particular purpose. Lastly, the author does not guarantee that any of the companies mentioned in the reports will perform as expected, and any comparisons made to other companies may not be valid or come into effect.
Chris Vermeulen Archive |
© 2005-2022 http://www.MarketOracle.co.uk - The Market Oracle is a FREE Daily Financial Markets Analysis & Forecasting online publication.