


The Inflation/Deflation debate wears on…
Stock-Markets / Inflation Sep 10, 2021 - 06:02 PM GMTBy: Gary_Tanashian

Our 30 year Treasury yield ‘Continuum’ chart indicates that deflation is the dominant trend, but…
Steve Saville has written a post that got me thinking about carts and horses and more precisely, which comes before which. Is the inflationary horse pulling the deflationary cart up hill or is the deflationary cart leading the horse to drink from the shrinking liquidity pool periodically?
See The Crisis-Monetisation Cycle
In conclusion to this short post Steve asserts…
“The crisis-monetisation cycle doesn’t end in deflation. The merest whiff of deflation just encourages central bankers and politicians to do more to boost prices. In fact, the occasional deflation scare is necessary to keep the cycle going. The cycle only ends when most voters see “inflation” as the biggest threat to their personal economic prospects.”
And over the course of decades now that is exactly the case. Every damn time that the public becomes terrified of declining asset (especially equity) prices the Fed springs into action.
On March 19, 2020 we asked…
A silly question on market sentiment… do you think pessimism is pervasive?
It was a question that needed no answer because the contents of the post showed casino patrons absolutely terrified of the deflationary event then in progress.
“Sentiment is aligned not over bearish, it’s not risk averse, but absolutely 100% terrified. And it’s one for the ages.”
On that same day we also noted that gold bugs had gone over the edge, emotionally…
Gold Stocks: Peak Bleak?
Fun times those were, and I am not joking about that. As a market manager and someone who writes about the markets please give me the kind of excitement that moves herds with extreme violence over the robo-trending (up or down) stuff that holds sway most often.
But I digress. That period was the last great deflationary knee jerk. On March 30, 2020 I posted an excerpt from NFTRH 596 (3.29.20)…
Why Inflation?
It began thusly…
Why inflation?
“The simple answer is that is what they are doing, inflating.”
So simple as to be pretty dumb, right?
Well, when you consider that the 30 year Treasury yield Continuum has trended down for decades, despite these periodic inflation events you see the major trend in markets is toward liquidation.
Ah, but it is not so simple. The Fed, with its ever more sophisticated methods of MMT (modern monetary theory) TMM (total market manipulation) has learned to use the dominant deflationary trend to its advantage and our advantage as speculators as well (just avoid the massive liquidations that are just as periodic as the inflationary moves along the Continuum’s decades).
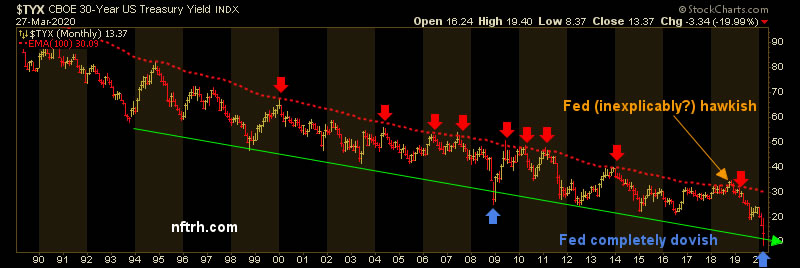
Here is the chart we used in that post to show in picture form the reason for a completely dovish Fed. Long-term Treasury yields were crashing along with the ramping deflationary angst of the time.
From the 3.29.20 excerpt linked above…
“The 30yr yield Continuum has logically gone hand in hand with another Continuum spanning decades; the one in consumer prices rising under the current system so firmly in place since gold was deleted from the official macro picture in the early 70s. Declining interest rates have allowed credit creation at every sign of trouble. Today is a massive sign of trouble and so a massive credit operation is in play. Money created out of nothing will eventually show up as rising prices somewhere or more likely, nearly everywhere.
The current crisis will paint a new grey area (recession) on the CPI graph. CPI will pull back, people will fear deflation and then when it’s ready, stimulated demand will be released and CPI will continue on its upward way.”
Here is the current Treasury yield Continuum (one of several indicators of inflation, the yield drops as bonds – a prime investment during deflation – rise, and the yield rises as bonds drop amid inflationary pressure), showing the March 2020 ultra dove situation and the rise in the yield to 2.5% that sprang from it last spring amid growing inflationary angst among the public.

We (NFTRH) anticipated a summer cool down well in advance as the yield approached 2.5%, and the indicator has been cooling ever since. There is still room to run for the current inflation cycle by this indicator. If the yield makes a right side shoulder that is somewhat symmetrical to the left side we could be looking at another upside (inflationary) ping of the limiting monthly EMAs 100 and 120.
But as to the premise of this post, the inflation/deflation debate, I’ll come down on the side of deflation as the dominant trend against which policymakers are allowed – and even compelled – to work inflationary magic by manipulating debt to suit their agenda, as long as public confidence in the system is intact. I know that there are plenty of people not at all confident in the system (including myself), but Joe Sixpack knows or cares little about this. He cares about what he’s paying for consumer prices, including his sixer and the burgers and dogs on the grill.
We have witnessed panic points to the deflationary downside (e.g. 2008 & 2020) and inflationary halt points to the upside (e.g. 2011 and 2018). Today the Continuum is in a middle ground. If the inflation resumes as expected, the rise could be attended by a more Stagflationary backdrop than the relatively pleasant recovery out of the 2020 deflationary terror fest.
If the Continuum continues we’ll see yields halt at or about the red limiters before some future exploration of the deflationary downside once again as the current inflationary operation unwinds.
This long-term monthly chart is trending down and that is what I call the deflationary backbone against which the Fed has ever more cleverly learned to inflate the system. As of today confidence in that system is intact (Joe’s sixpack is still affordable). But forever? No way, and the direction it will be resolved is, in my opinion, likely to be deflationary because that is the multi-decade trend; down. Also, this system of Inflation onDemand could limp on for years, even decades more. We just don’t know.
In the interim I will stupidly use tools (picture a macro economic caveman) like the picture directly above. The system could well end one day in a Crack-Up-Boom, where inflation rips through the Stagflation phase and keeps on going right up its own tailpipe in an inflationary bonfire.
So if the Continuum pings the limiters again as it has periodically in the past, I for one will not be intellectualizing about the inflation/deflation debate. I’ll be watching two simple red lines, one solid and one dashed.
Subscribe to NFTRH Premium (monthly at USD $33.50 or a 14% discounted yearly at USD $345.00) for an in-depth weekly market report, interim market updates and NFTRH+ chart and trade setup ideas, all archived/posted at the site and delivered to your inbox.
You can also keep up to date with plenty of actionable public content at NFTRH.com by using the email form on the right sidebar and get even more by joining our free eLetter. Or follow via Twitter ;@BiiwiiNFTRH, StockTwits or RSS. Also check out the quality market writers at Biiwii.com.
By Gary Tanashian
© 2021 Copyright Gary Tanashian - All Rights Reserved
Disclaimer: The above is a matter of opinion provided for general information purposes only and is not intended as investment advice. Information and analysis above are derived from sources and utilising methods believed to be reliable, but we cannot accept responsibility for any losses you may incur as a result of this analysis. Individuals should consult with their personal financial advisors.
Gary Tanashian Archive |
© 2005-2022 http://www.MarketOracle.co.uk - The Market Oracle is a FREE Daily Financial Markets Analysis & Forecasting online publication.